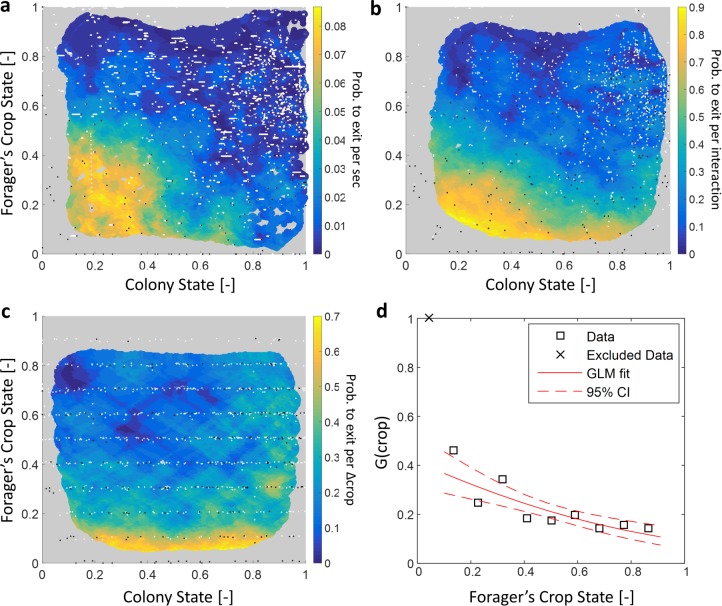
Figure 6. Forager exits.
(a–c) Forager exit probabilities as a function of the colony state and her own crop state. All panels relate to the pooled data from all three observation experiments. Observations are plotted on a 2-dimensional space of the forager’s crop state and the colony state, as black and white dots (white - ‘stay’ observations, black - ‘exits’). An observation was classified as an ‘exit’ if the forager left the nest before the next considered observation. The colored surface represents the estimated local probability to exit on this space, calculated as the fraction of ‘exits’ out of all observations in each bin in the space: the color of each pixel on the surface represents the probability calculated based on the closest data points, and the pixel’s location is the average location of these points (a: , b-c: ). The three panels consider three possible decision rates: Constant decision rate (a) where all observations, taken every two seconds, were considered to be decision points (excluding observations during trophallaxis). Decision rate matched to interaction rate (b) where only observations at ends of interactions were considered to be decision points. Decision rate matched to unloading rate (c) where only observations taken each time a forager unloaded food, were considered to be decision points (=10% of the forager’s capacity). (d) , a projection of the two-dimensional probability presented in panel c on the forager’s crop state axis. Since foragers’ crop loads rarely rose in the nest, their lowest crop observation in a visit was generally an ‘exit’, so the calculated probability to exit in the lowest crop interval was 1. To ensure that the crop state played a role beyond this extreme effect, the GLM fit did not include the lowest crop interval. The crop load effect was significant: , . Source file for panels a and c is available in the Figure 1—source data 2. Source file for panel b is available in the Figure 1—source data 1.

