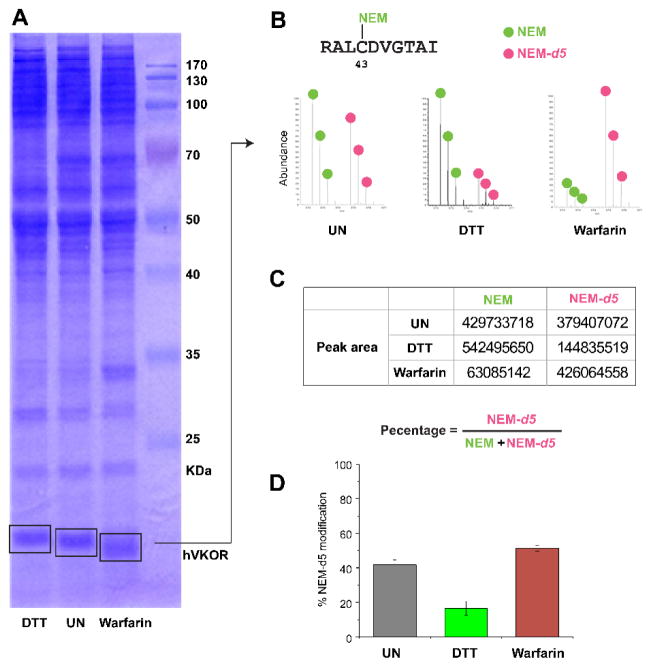
Figure 2. Quantification analysis of cysteine modification level.
A. Reducing SDS-PAGE serves as an additional purification step after the hVKOR protein is affinity purified. The sliced gel bands (boxes) are used for in-gel isotope labeling and digestion. B. LC/MS/MS analysis of a peptide containing Cys43, which is modified by NEM (green spheres) and NEM-d5 (red). C. Peak areas of the modified peptides are used for calculating percentage of NEM-d5 modification. D. Analysis results are displayed as a bar graph.

