
Figure 3.
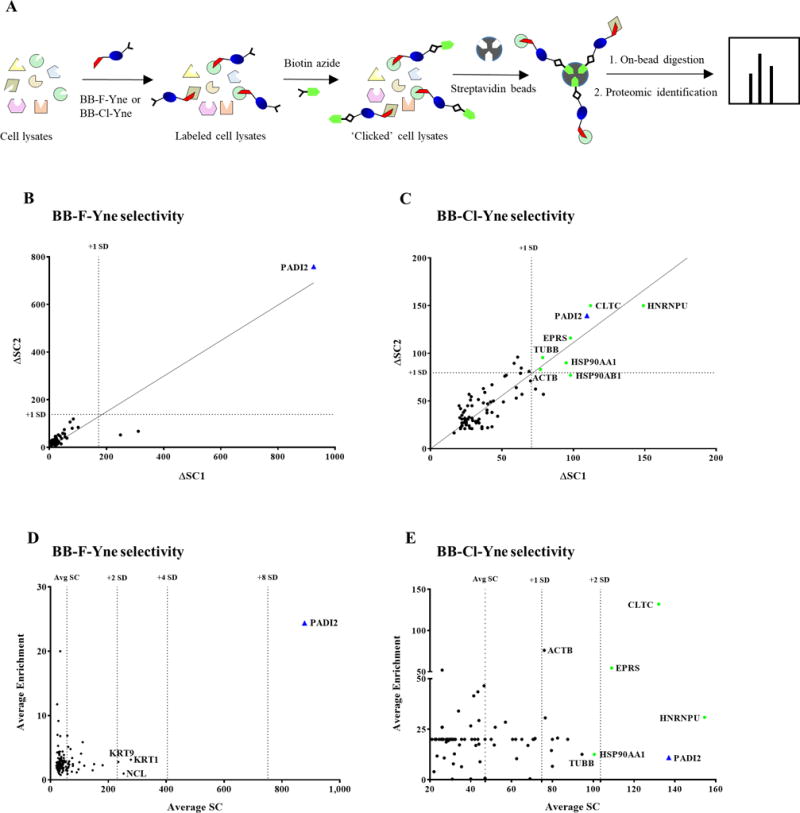
(A) Workflow showing probe labeling of cell lysates by BB-F-Yne (25 μM) or BB-Cl-Yne (2.5 μM) followed by coupling with biotin-N3. Labeled proteins were selectively separated using streptavidin agarose beads. (B and C) Plot showing the difference in spectral counts between the sample and the control (Δ SC) for the experimental replicates. (D and E) A plot of average enrichment versus average spectral counts for BB-F-Yne and BB-Cl-Yne labeled cell lysates from proteomics analysis.