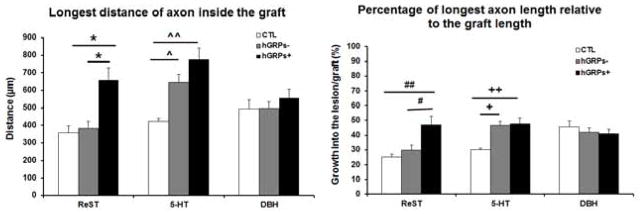
Figure 5.
Analysis of longest distance of motor axon inside the graft (left) demonstrated that there is a significant increase of ReST growth in the GRP+ group compared to control (CTL) and GRP− groups. For regeneration of 5-HT, the growth distance into the transplant is significantly increased in both GRP− and GRP+ compared to the control group. However, the distance of DβH axons growing into the lesion in all groups was similar without significant differences. Analysis of percentage of longest axons length relative to the graft length (right) showed that the hGRP transplant promoted ReST axons growing half length of the graft, significantly longer than control and GRP− groups. 5-HT axons grew into the graft near half of the graft length in both GRP− and GRP+. The percentage of DBH axons did not show significant differences among all groups. In the left: one way ANOVA, F (2,30) =9.539, p=0.001; BONFERRONI’s post hoc test, *p<0.02, hGRP+ vs hGRP− or CTL; one way ANOVA, F (2,30) = 11.375, p=0.000; BONFERRONI’s post hoc test, ^p<0.0017, hGRP− vs CTL, ^^p= 0.000 hGRP+ vs CTL. In the right: one way ANOVA, F (2,29) = 7.056, p<0.003; BONFERRONI’s post hoc test, #p<0.04 hGRP+ vs hGRP−; ##p<0.004, hGRP+ vs CTL; one way ANOVA, F (2,30) = 9.328, p<0.001; BONFERRONI’s post hoc test, +p<0.003 hGRP− vs CTL; ++p<0.001, hGRP+ vs CTL. n = 3 for CTL group; n = 4 for both hGRP− and hGRP+ groups. Data = Mean ± S.E.M.

