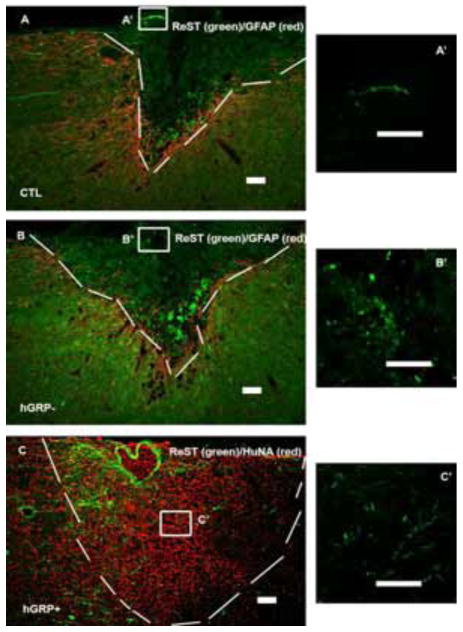
Figure 6.
Regeneration of reticulospinal axons (ReST). The lesion/transplant area is identified with GFAP (A and B, red) and HuNA (C, red) IHC staining and outlined with white dash lines. ReST axons (green) grew into the injury only a very short distance (A), same as transplant without cell survival (B). However, transplants with cell survival attracted ReST regenerating further into the lesion/transplant (C). Panels A′, B′ and C′ are high magnification of ReST axons within boxes in Figure 4A, B and C. Scale bar =100 μm in all images.

