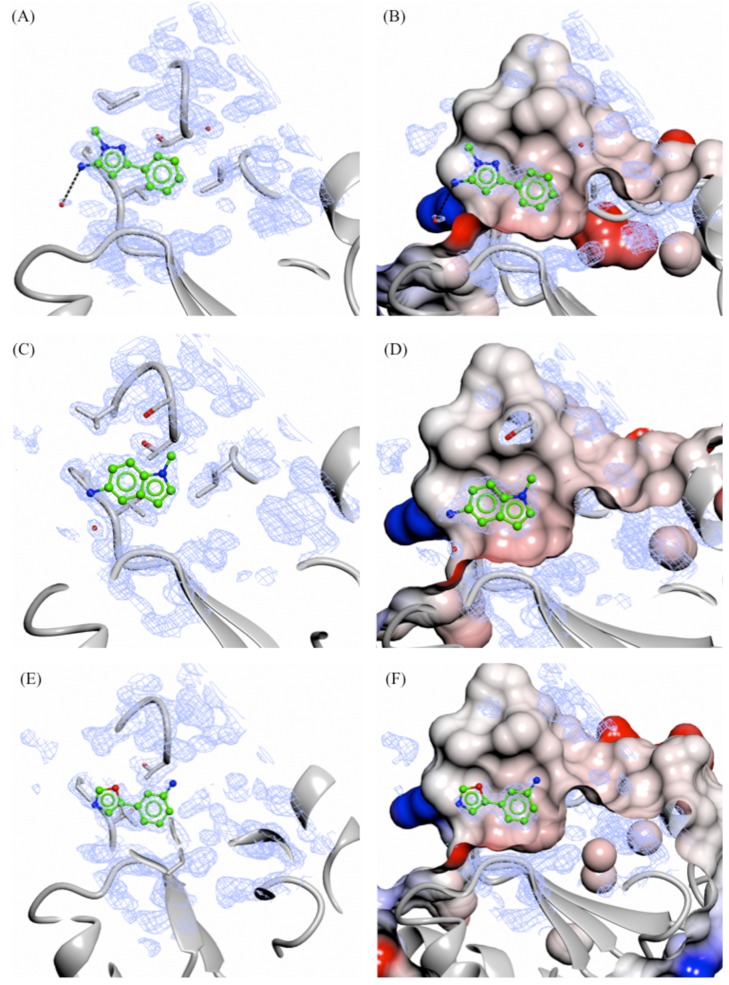
Figure 6. X-ray crystal structures of fragments not showing specific interactions bound to the adenine-subsite of PHGDH.
Crystal structures of bound fragment 3 (A. and B., 1.33 Å resolution), 9 (C. and D., 1.53 Å resolution) and 10 (E. and F., 1.53 Å resolution) are shown. The Fo-Fc omit electron density map is shown as green wire at contour levels of 0.5 electrons/Å3. The left-hand panels show the protein as a grey ribbon representation with selected side-chains drawn as sticks with carbon atoms in grey. The right-hand panels show the protein surface coloured by electrostatic potential.

