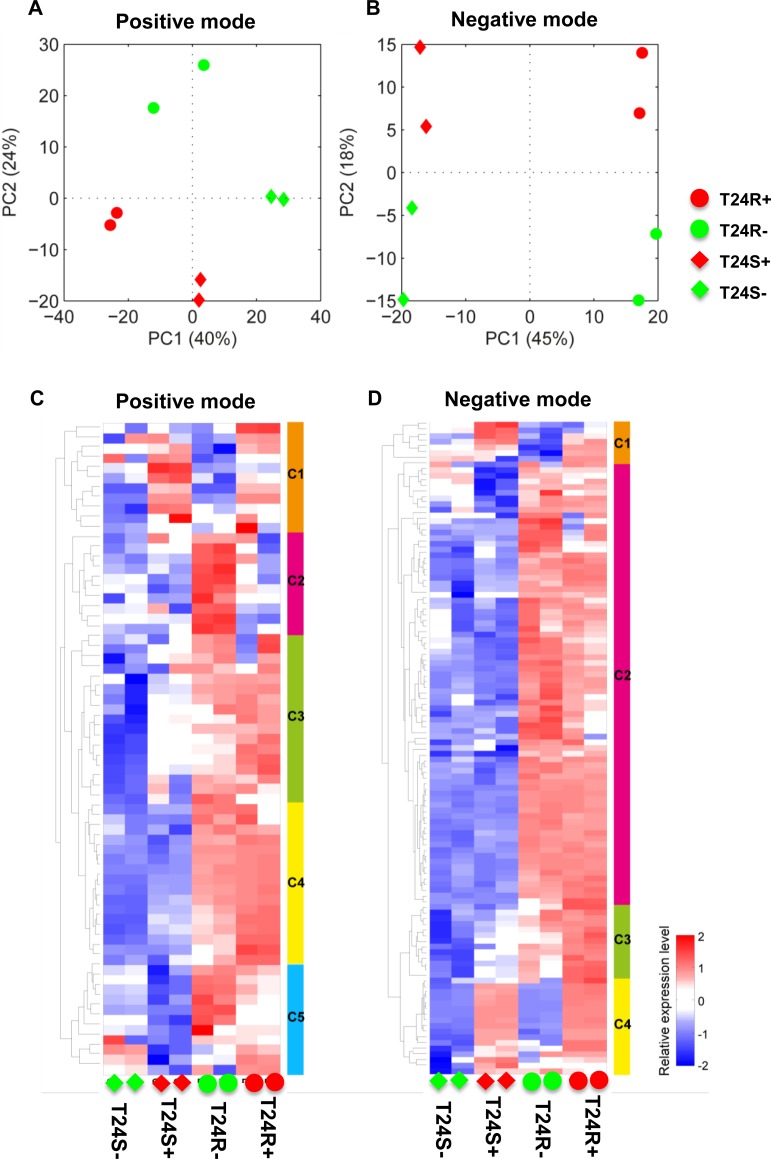
Figure 2. Differentially expressed lipids in T24R compared to T24S.
(A–B) Principal component analyses (PCA) of lipid profiles of T24S and T24R in the absence or presence of ACSS2 inhibitor were shown. The lipid profiles were acquired in (A) positive ion mode and (B) negative ion mode. S and R indicate cisplatin sensitive and resistant bladder cancer cell lines. The positive (+) and negative (-) symbols indicate treatment of ACSS2 inhibitor and vehicle, respectively. (C–D) Heatmaps showing differentially expressed lipids in T24R compared to T24S in the absence and the presence of ACSS2 inhibitor treatment. (C) DELs identified in positive mode, and (D) in negative mode.

