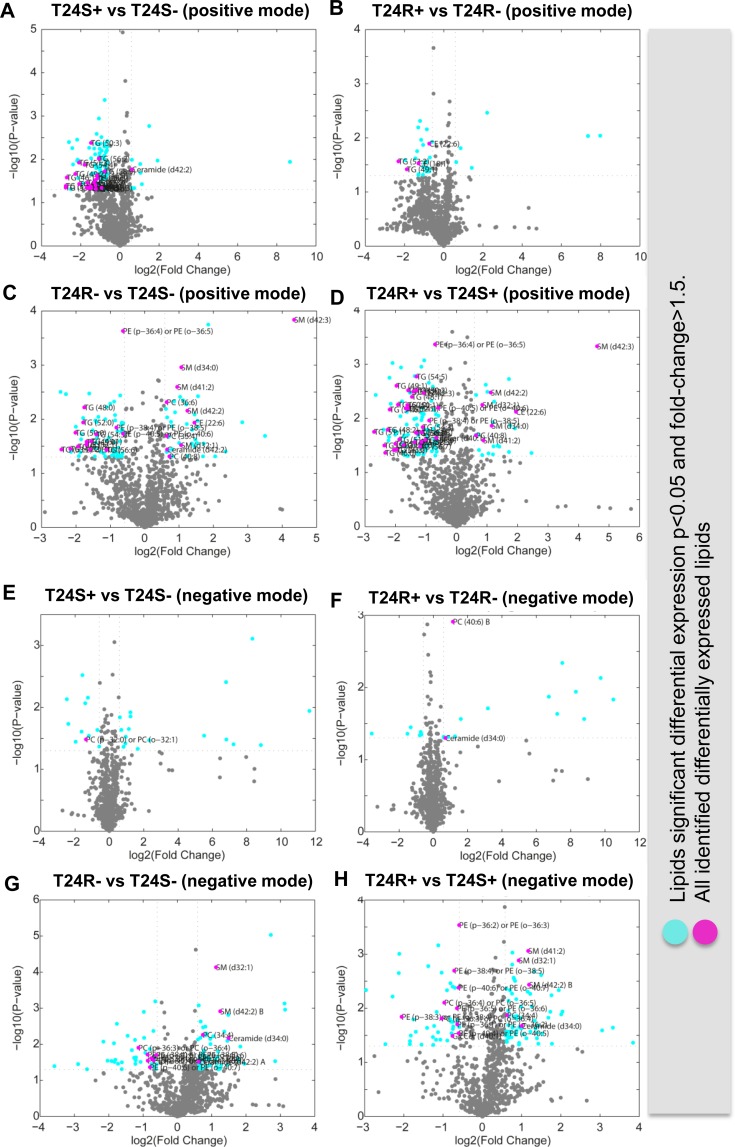
Figure 3. Volcano plots of cisplatin sensitive and resistant bladder cancer cell lines.
(A–D) Positive ion mode. (A) T24S+ and T24S–; (B) T24R+ and T24R–; (C) T24R– and T24S–; (D) T24R+ and T24S+. Cyan dots indicate the DEL (p < 0.05 and fold-change >1.5). Magenta dots indicate the identified DEL. (E–H) Negative mode. (E) T24S+ and T24S–; (F) T24R+ and T24R–; (G) T24R– and T24S–; (H) T24R+ and T24S+. Cyan dots indicate the DEL (p < 0.05 and fold-change >1.5). Magenta dots indicate the identified DEL. The x-axis and y-axis show log2-tranformed fold changes and log10-transformed p-values.

