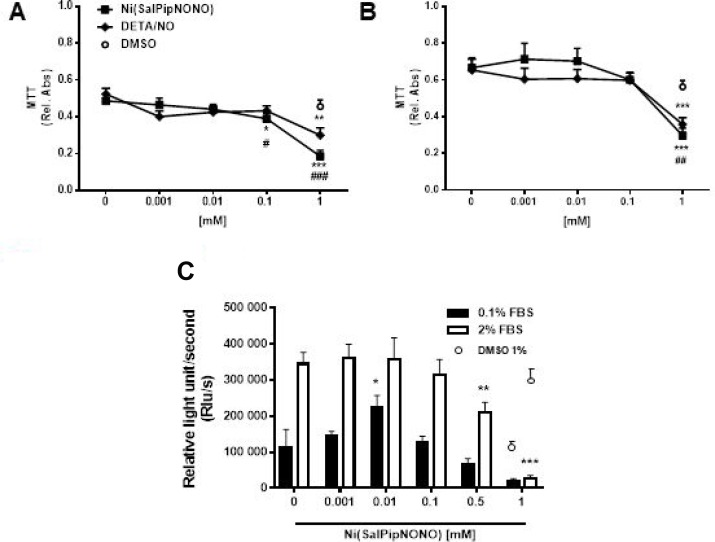
Figure 1. Ni(SalPipNONO) dose dependently inhibits tumor cell growth.
A549 cells were treated with increasing concentrations of NO donors (0.001–1 mM) in the presence of 0.1% (A) and 2% (B) serum and cell viability was evaluated by MTT after 72 h. Data are reported as relative absorbance ± SD (n = 3). Cell proliferation after 24 h was assessed by BrdU incorporation assay (C). Data are reported as luminescence ± SD (n = 3). The highest concentration of DMSO (1% v/v) used as vehicle was reported as control. *p < 0.05, **p < 0.01 and ***p < 0.001 vs untreated cells. #p < 0.05, ##p < 0.01 and ###p < 0.001 Ni(SalPipNONO) vs DETA/NO.

