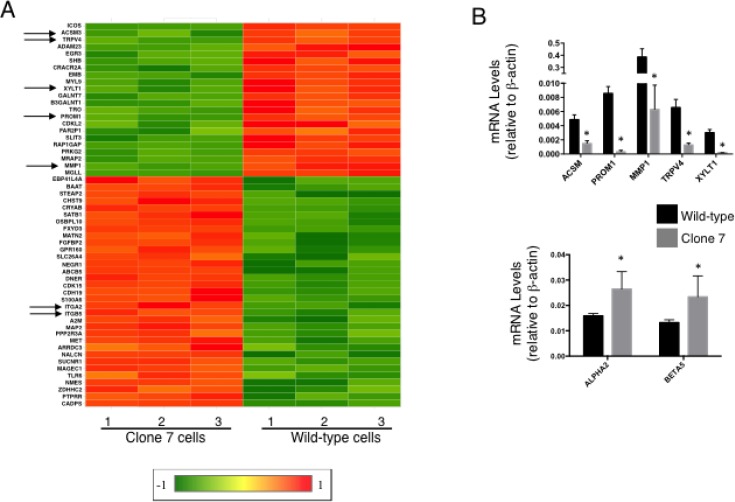
Figure 4. SELENOK deficiency alters transcriptional control of growth, migration and stemness.
(A) Gene arrays were used to compare SELENOK deficient Clone 7 cells to w.t. cells (N = 3 per group). Differentially expressed genes most related to cancer growth were selected based on Exp2 (Array Studio default) transformed > 2-fold higher or lower than controls with Benjamini & Hochberg FDR-adjusted p-value < 0.05. A heat map was generated using the linear gene expression values, which were normalized by dividing by w.t. average and robust center scaling with a linear range of 1 to -1. Down-regulated (green) and up-regulated (red) genes are shown for Clone 7 compared to w.t. cells or vice versa. Arrows indicate genes that were further evaluated. (B) Real-time PCR was used to measure relative mRNA levels for selected genes. Results confirmed that Clone 7 cells exhibited down-regulation of five transcripts involved in promoting growth, stemness, and migration (upper graph) and up-regulation of 2 transcripts involved in adhesion (lower graph). Means of replicates (N = 4) were compared using a student’s t-test and expressed as mean + SEM with *p < 0.05.

