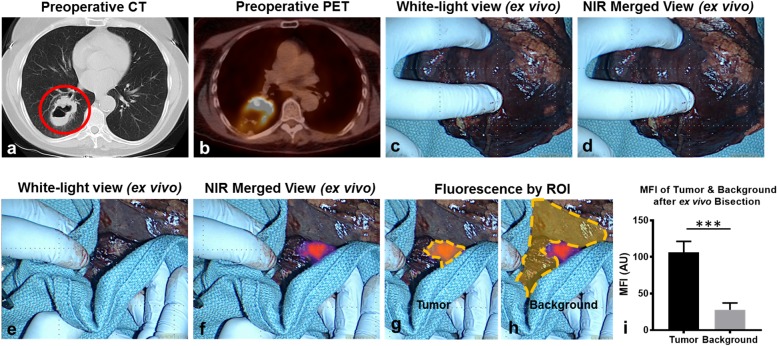
Figure 2. SCCs display strong fluorescence upon ex vivo tumor bisection.
Representative example: Subject 1 presented with a 5.2cm right lower lobe nodule (a) that displayed an SUV of 13.1 (b). During in situ and ex vivo analysis, no parenchymal changes were appreciated during white light evaluation (c) nor during NIR molecular imaging (d). Upon ex vivo tumor bisection, the tumor was visualized both by white light inspection (e) and by NIR molecular imaging (f). Fluorescent intensity was quantified for ROIs corresponding to the tumor (g) and benign pulmonary parenchyma (background) (h). Mean fluorescent intensities were compared for SCCs (n=9) displaying ex vivo fluorescence during back-table inspection (i). Red circle-pulmonary SCC; yellow gates-ROIs measured by fluorescent analysis; ***p<0.001.

