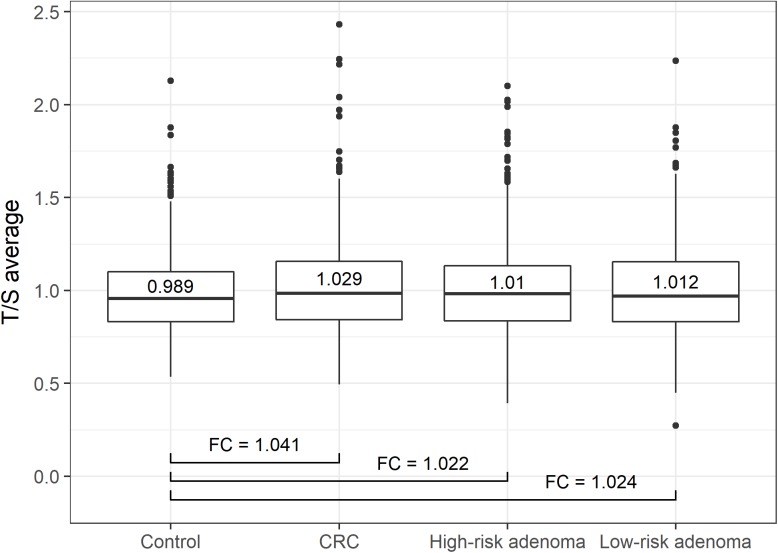
Figure 1. Status-wise distribution of average T/S ratios.
Boxplots depict the distribution of average T/S ratios of each histological status group. CRC patients presented a significantly longer telomere length than controls (P-value = 3.61x10⁻⁶). Patients with high-risk and low-risk adenoma did not significantly differ from the control group (P-value = 0.05956 and 0.05224, respectively). Fold changes (FCs) are calculated based on the average T/S ratio for control/CRC, control/high-risk adenoma and control/low-risk adenoma.

