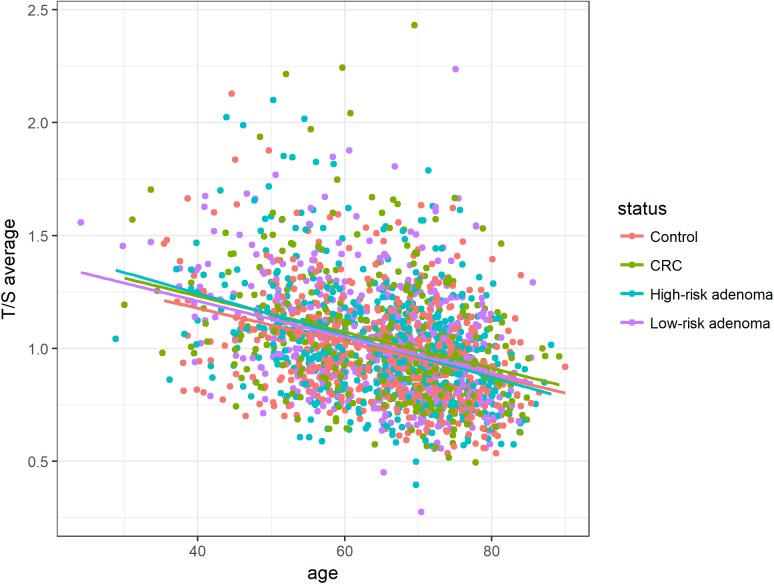
Figure 2. Association between age and relative telomere length for histological status groups (controls, CRC, high-risk adenoma and low-risk adenoma).
Average T/S ratios were inversely associated with age among all histological status groups. Linear equations and correlation values (CV): Controls: 1.75 - 0.011 * Age (CV: -0.36), CRC: 1.88 - 0.013* Age (CV: -0.32), High-risk adenoma: 1.87 - 0.013 * Age (CV: -0.39), Low-risk adenoma: 1.80 - 0.012 * Age (CV: -0.34).

