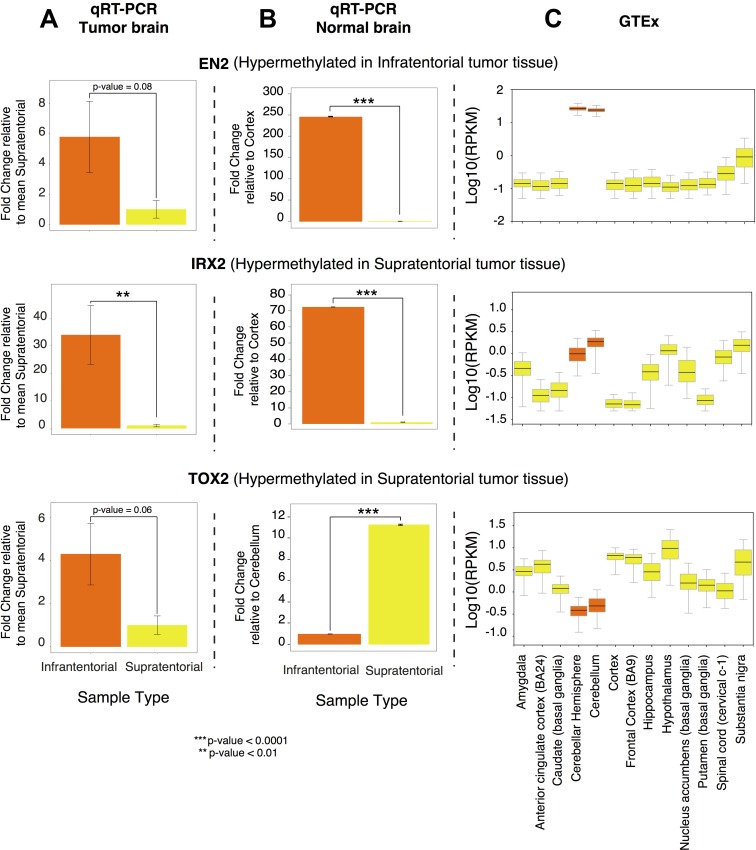
Figure 4. EN2, IRX2, TOX2 gene expression profile.
(A) Differential expression obtained by qRT-PCR on the PA samples collected in the present study, calculated using the ΔΔCT method and expressed as fold change relative to the supratentorial mean expression value; (B) Differential expression obtained by qRT-PCR on commercially available normal brain RNA, calculated using the ΔΔCT method and expressed as fold change relative to the lowest expression value; (C) Gene expression in normal brain tissue, according to GTEx portal (Genotype-Tissue Expression portal). Expression value are shown in log10(RPKM) (Reads Per Kilobase of transcript per Million mapped reads), calculated from a gene model with isoforms collapsed to a single gene. In orange: supratentorial localization and related brain regions; in yellow: infratentorial localization and related brain regions.

