
Figure 7. Construct cell number declines with time in the absence of TGFβ2.
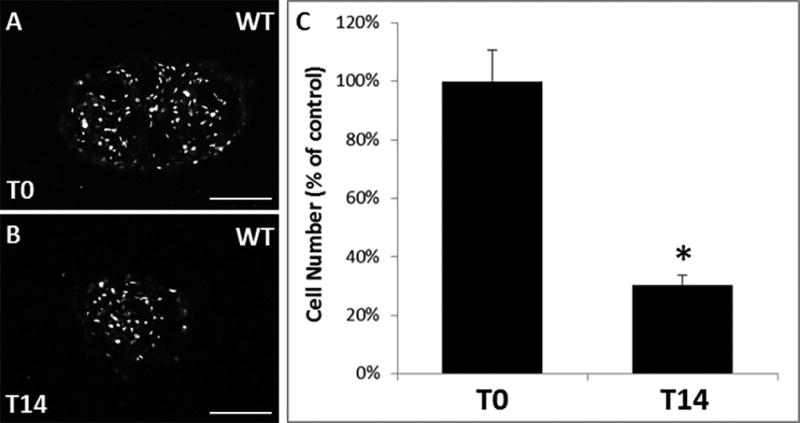
DAPI staining of (A) WT control construct at T0 and (B) WT control construct at T14. (C) Average cell number decreases from T0 to T14 in WT constructs (percentage of T0 control). * indicates p<0.05 compared to T0 control. Scalebars: 100 µm.