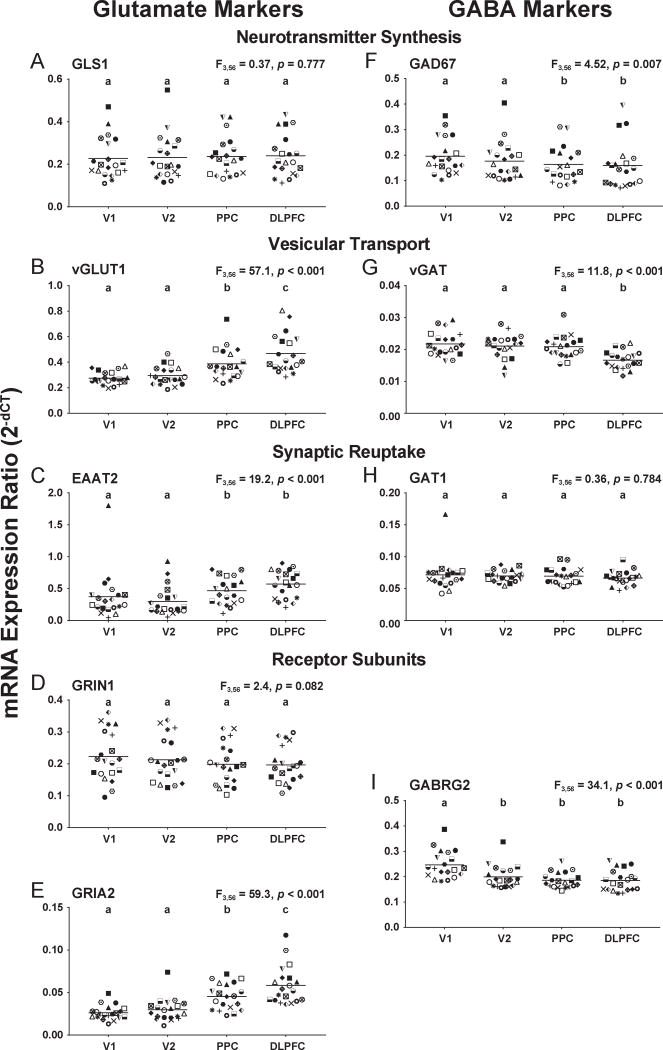
Figure 2. Glutamate and GABA transcript levels in layer 3 across cortical regions of the vsWM network in unaffected comparison subjects.
For each panel (A-I), target transcript name is at the top center and ANCOVA results for the effect of region at the top right. Individual subjects are shown by the same symbol in all graphs. Horizontal bars represent group means. Regions within each graph that do not share the same letter are significantly different (p<0.05). V1, primary visual cortex; V2, association visual cortex; PPC, posterior parietal cortex; DLPFC, dorsolateral prefrontal cortex.

