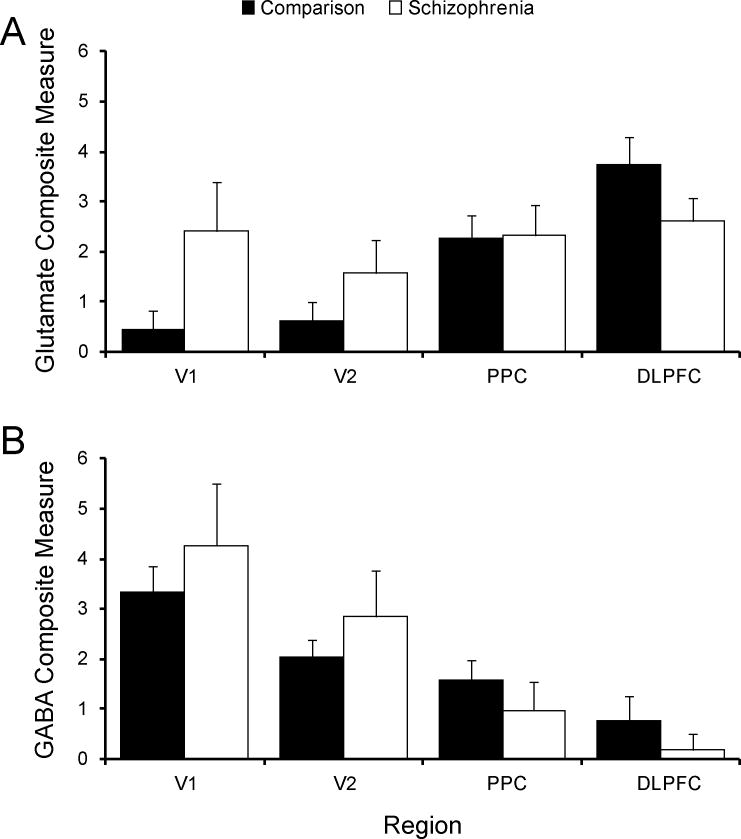
Figure 4. Effect of schizophrenia on composite measures of glutamate and GABA transcripts in the vsWM network.
In unaffected comparison subjects, the composite A) glutamate (F3,114=14.5, p<0.001) and B) GABA (F3,114=5.4, p=0.002) measures showed significant, and opposite, caudal-to-rostral gradients. Note that in the schizophrenia subjects, this gradient was lost for the glutamate measure (F3,114=1.3, p=0.28), but was more highly significant for the GABA measure (F3,114=15.8, p<0.001). Accordingly, the region-by-diagnosis interaction was significant for the glutamate (F3,114=5.1, p=0.002), but not for the GABA (F3,114=1.7, p=0.18), composite measure. V1, primary visual cortex; V2, association visual cortex; PPC, posterior parietal cortex; DLPFC, dorsolateral prefrontal cortex.

