Fig. 4.
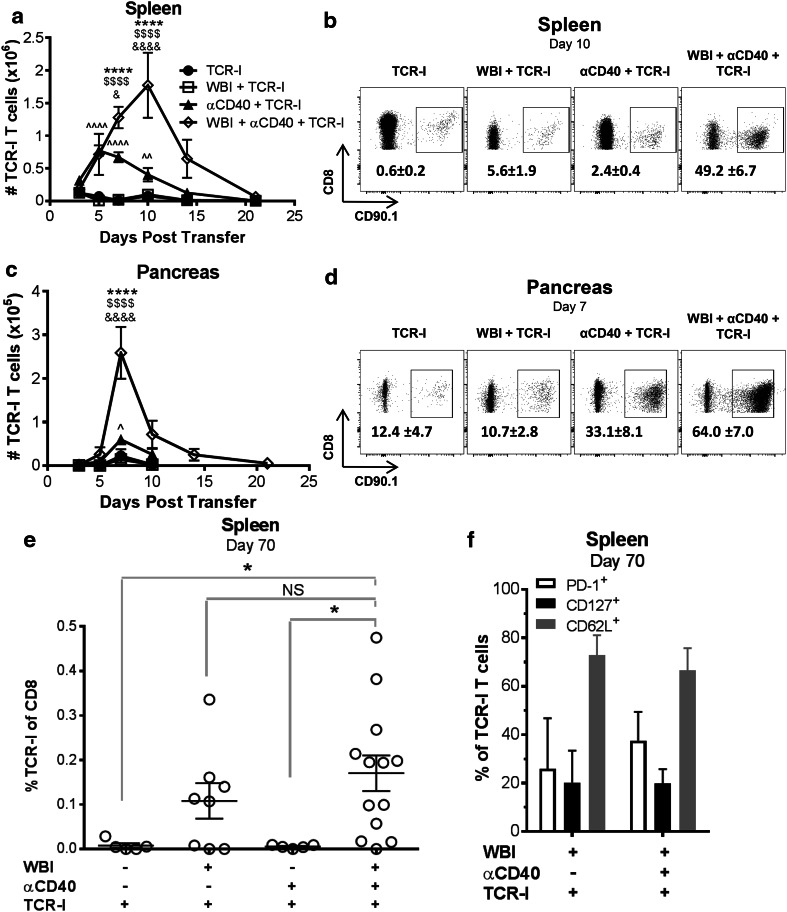
Dual conditioning enhances accumulation of TCR-I cells in the spleen and pancreas. a, b Absolute numbers of CD90.1 + or TetI + TCR-I cells in the spleen (a) and pancreas (c) were determined by flow cytometry. N = 6–18 mice/group (days 3–10), 2–10/group (days 14, 21). WBI + αCD40 + TCR-I vs. TCR-I (asterisk), vs. WBI + TCR-I (dollar symbol), vs. αCD40 + TCR-I (ampersand); αCD40 + TCR-I vs. TCR-I alone (hat symbol). 1 digit p < 0.05, 2 digits p < 0.01, 4 digits p < 0.0001 by two-way ANOVA with Bonferroni corrections. b, d representative flow cytometry plots for TCR-I T cells recovered from spleen (b) and pancreas (d). Numbers inside the dot plots represent the mean percentage of each group +/− SE of CD8 + cells identified as TCR-I cells. e TCR-I T cells recovered from the spleen 70 days post treatment. N = 5–13/ group. WBI + αCD40 + TCR-I vs. indicated group, *p < 0.05 by one-way ANOVA with Dunnett’s post-test, NS not significant. f Proportion of donor TCR-I T cells expressing the indicated surface markers 70 days post treatment. N = 2–7/group. No significant differences by Student’s t test

