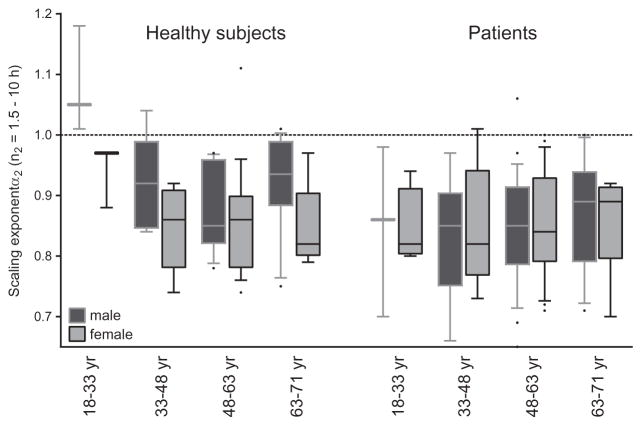
Figure 3.
Scaling exponent α2 (times scales 1.5–10 h) in 72 healthy subjects and 90 patients (NFMA and craniopharyngioma). Data are separated by gender and in four age groups. In healthy subjects, group size for each age group in men is 3, 8, 11 and 16, and for women 3, 7, 19 and 5. For patients, group size for each age group in men is 3, 9, 25 and 13, and for women 4, 6, 21 and 9. The dotted line represents complex scale invariance with α = 1.0. Boxes display the 25th, 50th and 75th percentile, bars the 10th and 90th percentile and dots the outliers.

