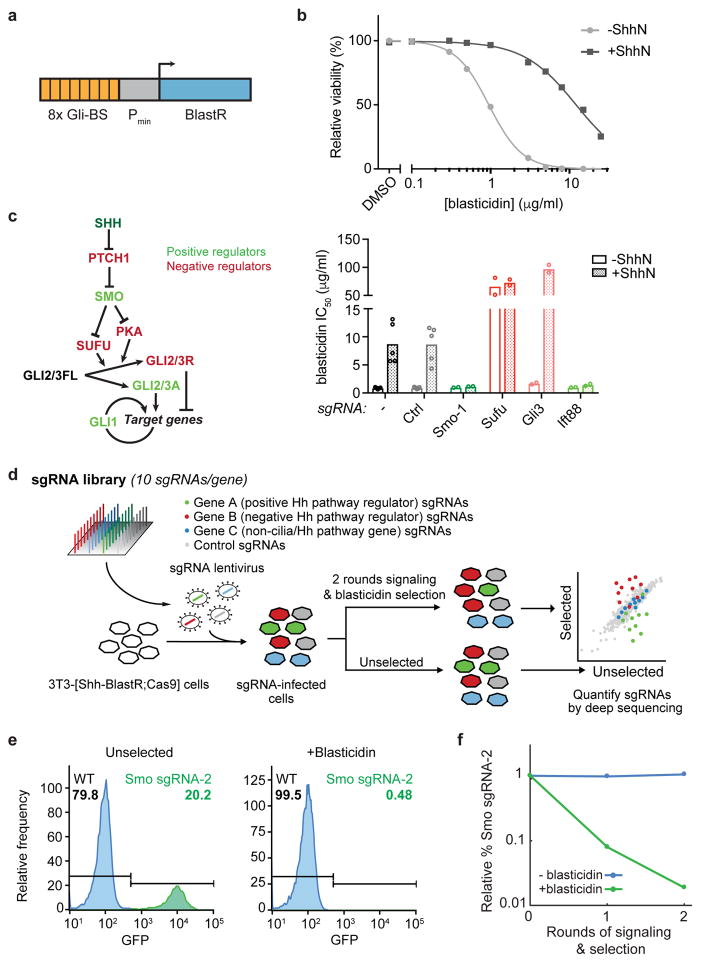
Figure 1. Development of a Hedgehog pathway reporter-based screening strategy.
a) A transcriptional reporter combining 8 copies of the GLI binding sequence (Gli-BS) with a minimal promoter (Pmin) to convert Hh signals into blasticidin resistance. b) Blasticidin resistance was assayed across a range of concentrations in stimulated (+ShhN) and unstimulated 3T3-[Shh-BlastR;Cas9] cells. Representative curves of 5 independent experiments performed in duplicate. c) Overview of the Hh pathway, with key negative and positive regulators shown in red and green, respectively (left). Effects of control sgRNAs on blasticidin resistance in stimulated and unstimulated 3T3-[Shh-BlastR;Cas9] cells (right). Bars show mean inhibitory concentration 50 (IC50) values and circles show IC50 values from N = 2 (for gene-targeting sgRNAs) or 5 (for no sgRNA and negative control (Ctrl) sgRNA) independent experiments performed in duplicate. d) Overview of the screening strategy. Cells receiving a negative control sgRNA, a positive regulator-targeting sgRNA, and a negative regulator-targeting sgRNA are shaded grey, green, and red, respectively. e) Flow cytometry histograms of cell mixtures showing the fraction of GFP positive (Smo sgRNA-2, green) cells either in the absence of selection (left) or after two rounds of signaling and selection (right). Representative results from three independent experiments. f) Quantification of cell depletion as in (e).

