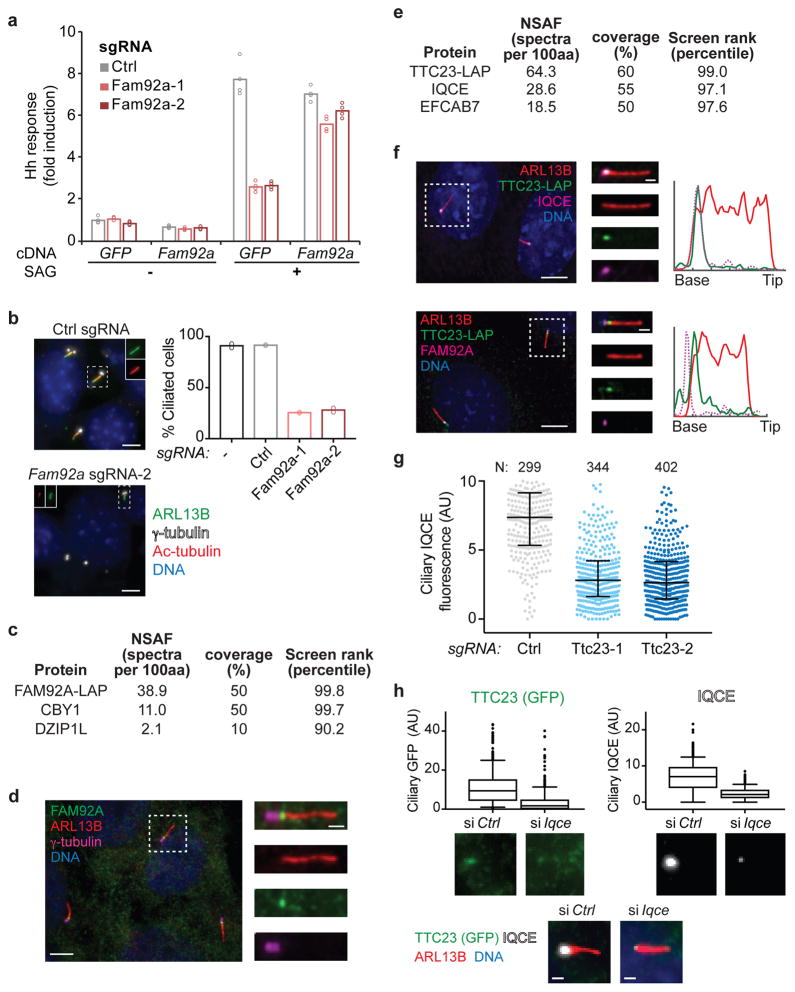
Figure 4. Characterization of FAM92A and TTC23 as transition zone and EvC zone components.
a) Induction of Hh pathway luciferase reporter is shown for cells transduced with the indicated sgRNAs and transfected with plasmids encoding Fam92a-3xFLAG (Fam92a) or GFP-FKBP (GFP). Cells were untreated or stimulated with SAG. Bars show mean of 4 replicate measurements (circles); one of two representative experiments. b) Analysis of cilia in 3T3-[Shh-BlastR;Cas9] cells transduced with the indicated sgRNAs. Bars show mean percentage of ciliated cells; dots show ciliated percentage in each of two independent experiments (>200 cells analyzed per datapoint). Scale bar: 5 μm c) Mass spectrometry analysis of FAM92A-associated proteins purified from IMCD3 cells. The normalized spectral abundance factor (NSAF), the percent of each protein covered by identified peptides, and the percentile rank of the corresponding gene in the screen are indicated. d) FAM92A localizes to the transition zone of IMCD3 cells, distal to centrioles (γ-tubulin) and proximal to the ciliary membrane (ARL13B). One of two independent experiments (five fields of view each). Scale bars: 5 μm and 1 μm (insets). e) Mass spectrometry analysis of TTC23-associated proteins purified from IMCD3 cells. f) TTC23-LAP co-localizes with IQCE, distal to FAM92A, in IMCD3 cells. Line plots show normalized intensity along the length of the cilium; tick marks are 1 μm intervals. Representative images are shown from two independent experiments (five fields of view each). Scale bars: 5 μm and 1 μm (insets). g) The median and interquartile range of ciliary IQCE levels are shown for cells transduced with the indicated sgRNAs; one of two independent experiments. h) Ciliary TTC23-LAP and IQCE signals were analyzed following introduction of Iqce-targeting or control (Ctrl) siRNAs. The median, interquartile range (box boundaries), 10–90% percentile range (whiskers), and outliers are plotted for N=390 (Ctrl) and N=300 (Iqce) cilia. One of two (IQCE) or four (GFP) replicate experiments. Scale bars: 1 μm.

