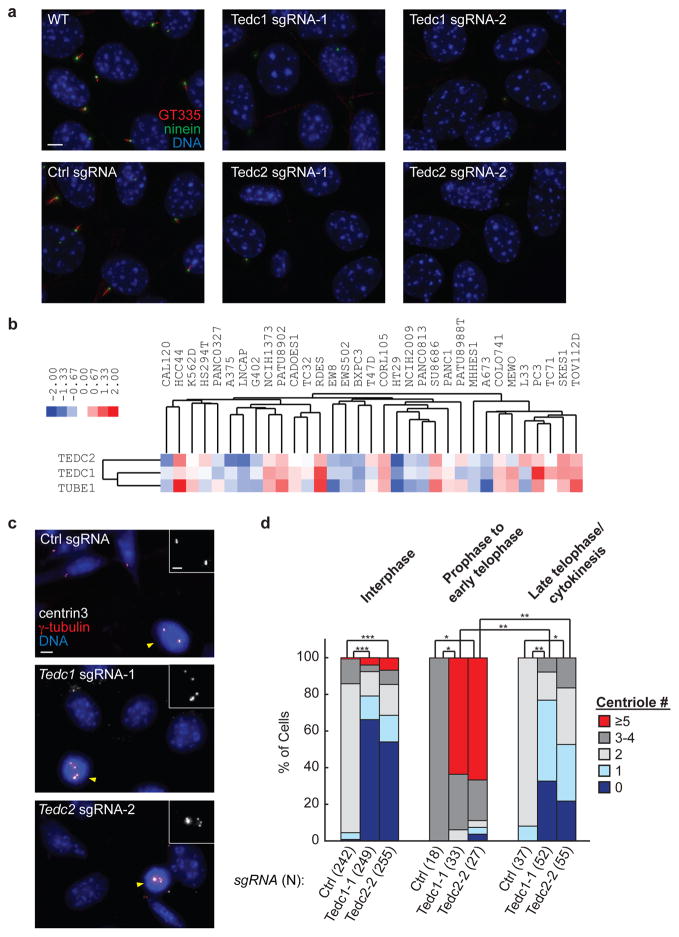
Figure 7. The TED complex is required for centriole stability.
a) Cells transduced with the indicated sgRNAs were stained with antibodies to ninein (centrioles) and polyglutamylated tubulin (GT335, centrioles and cilia). Scale bar: 5 μm. One of three representative experiments. b) Hierarchical clustering of relative growth scores across the indicated cell lines reveals that TEDC1, TEDC2, and TUBE1 share a similar pattern of relative fitness. Blue and red shading indicates decreased and increased proliferation relative to the average behavior across all cell lines. c) For cells transduced with the indicated sgRNAs, centrioles were visualized by staining with antibodies to centrin3 and γ-tubulin. Insets show centrin3 staining in mitotic cells, marked by yellow arrowheads. Scale bars: 5 μm (2 μm for insets). See also Supplementary Fig. 6h. One of three representative experiments. d) Centrioles marked by centrin3 and γ-tubulin were counted in cells at the indicated cell cycle stages. Statistically significant differences in centriole counts are shown for select conditions (*, P < 1×10⁻⁶; **, P < 1×10⁻¹⁰; ***, P < 1×10−60, determined by two-sided Fisher’s exact test).

