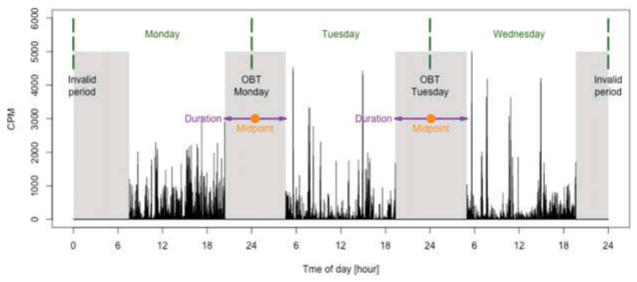
Figure 1.
Graphical representation of OBT. Black vertical lines represent activity counts per minute (CPM), gray areas represent non-wear periods, green dashed lines separate days of the week, purple arrows indicate OBT durations and orange points represent OBT midpoints. The invalid period on the left was considered invalid because no physical activity data were recorded before it. The invalid period on the right was considered invalid because no physical activity data appear after it.

