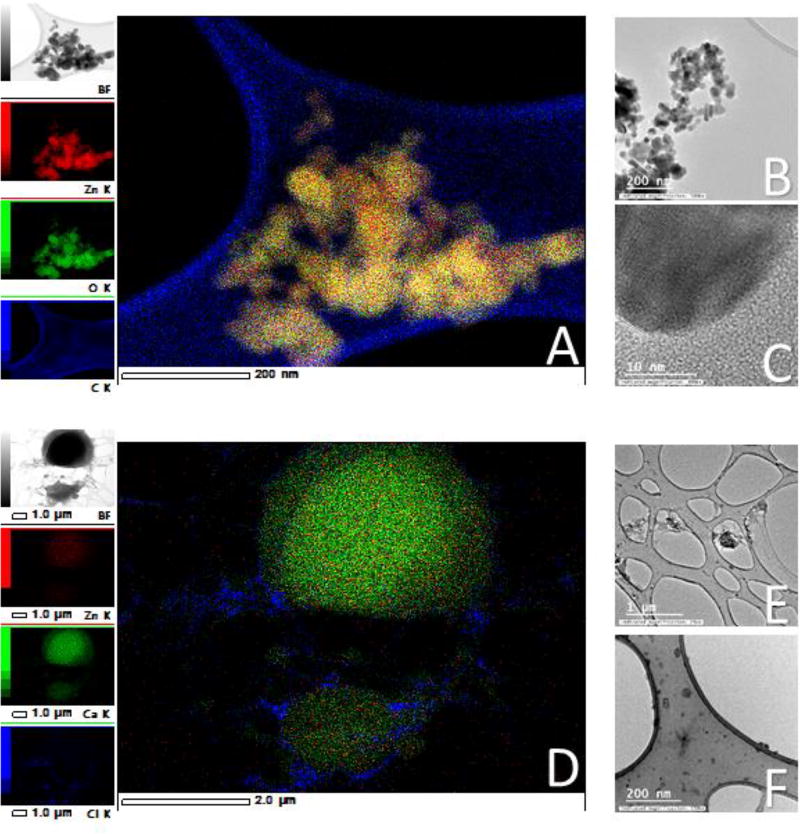
Figure 2. Nanoparticles in methanol (A–C) and following a simulated gastric and intestinal digestion (D–F).
A) Energy dispersive X-ray spectroscopy map of zinc oxide nanoparticles (ZnO NP) suspended in methanol. The nanoparticles are well defined and the Zn corresponds to the size and shape of the particle in the original image. Scale = 200 nm. B) A ZnO nanoparticle aggregate larger than 200 nm, but the individual particles can be easily discerned. Nanoparticles ranged between 15–23 nm in size. Scale bar = 200 nm. C) A high magnification of a single ZnO NP in which the lattice fringe of the NP is visible. Scale = 10 nm scale. D) Energy dispersive X-ray map of 1×10¹¹ digested ZnO nanoparticles/mL. The crystalline form of the NP has disappeared, and the Zn has accumulated in certain areas of the grid, associating mainly with Ca. This is evidence that the NP dissolve in complex solutions. Scale = 2 µm. E & F) TEM views of medium digest. Scale = 1µm and 200 nm, respectively.

