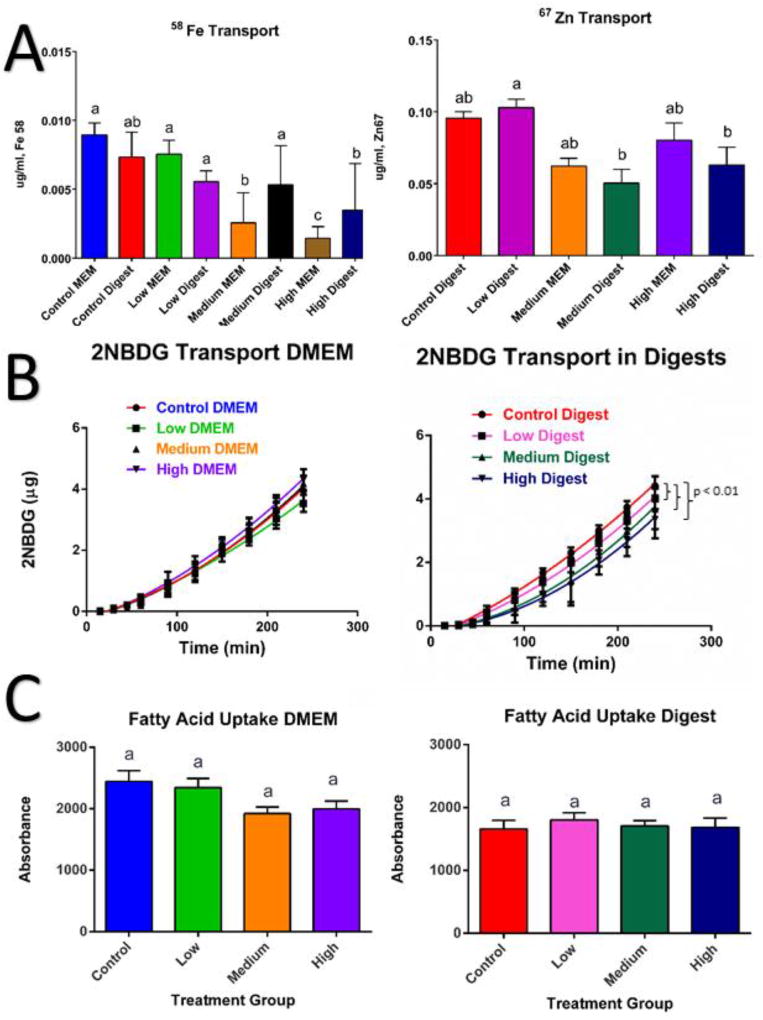
Figure 6. Overview of macronutrient transport and uptake affected by ZnO nanoparticles (NP).
Cells were exposed to low, medium and high doses of ZnO NP in DMEM in digests for four hours prior to experiments. A) Transport of the 58Fe stable isotope and 67Zn stable isotope representative from the small intestine lumen to the bloodstream. B) Transport of glucose representative from the small intestine lumen to the bloodstream using a fluorescent glucose analog (2-NBDG) after addition of ZnO NP in DMEM and digests. C) Fatty acid uptake after exposure to ZnO NP in DMEM and digests. For panels A & C, data was analyzed with a one-way ANOVA with Tukey’s multiple comparison test and data was considered significant at p<0.05. Mean±SEM and Tukey groups are shown (A,C). In panel B curve fits (solid black lines) were compared using the AICs from a quadratic model. Bars that do not share any letters are significantly different according to statistical analysis. Low, medium and high refer to the dose of ZnO nanoparticles, where low = 9.7 × 10⁻⁶ mg/mL, medium = 9.7 × 10⁻⁴ mg/mL, and high = 9.7 × 10⁻² mg/mL. Digest refers to ZnO nanoparticles that have been subjected to a simulated gastric and intestinal digestion.

