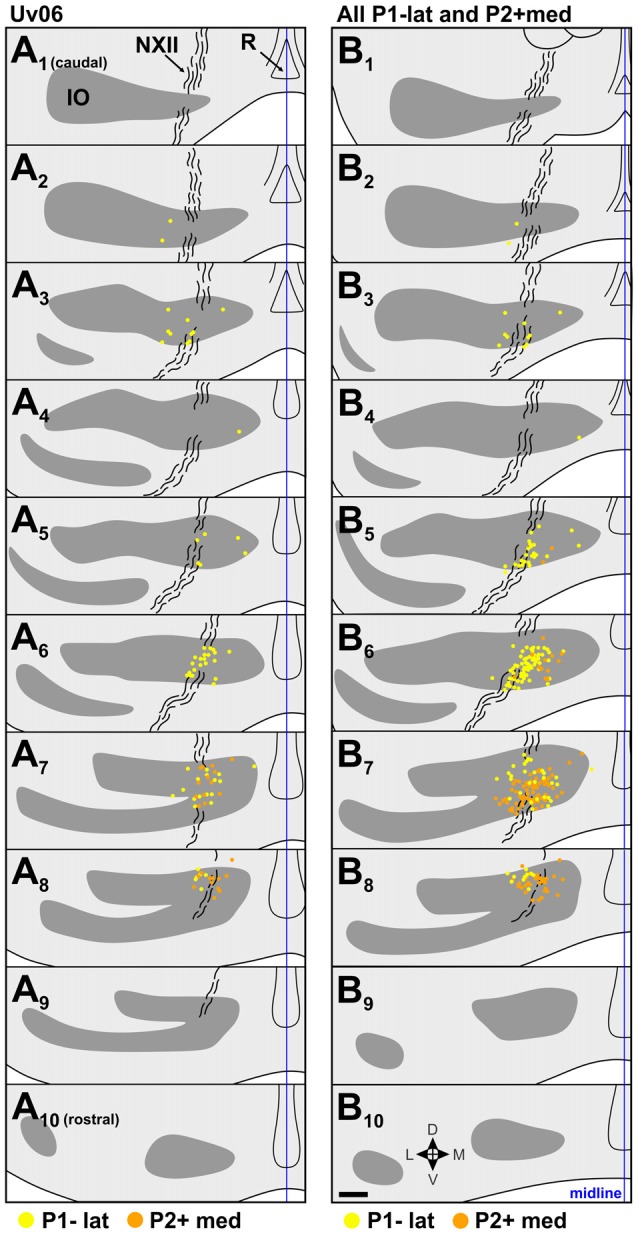
Figure 5.

Retrograde IO labeling from injections in the expansion/ascent optic flow zone. (A) shows labeled cells from case Uv06, and (B) shows labeling from all injections in P1−lat and P2+med collapsed onto an idealized series (cases Uv06, Uv08, Un05, Uv02, Uv16; see Figures 3D–H and Table 1). The locations of labeled cells from injections in P1−lat and P2+med are represented by yellow and orange dots, respectively. See caption to Figure 4 for additional details. Scale bar = 200 μm.
