
FIGURE 2.
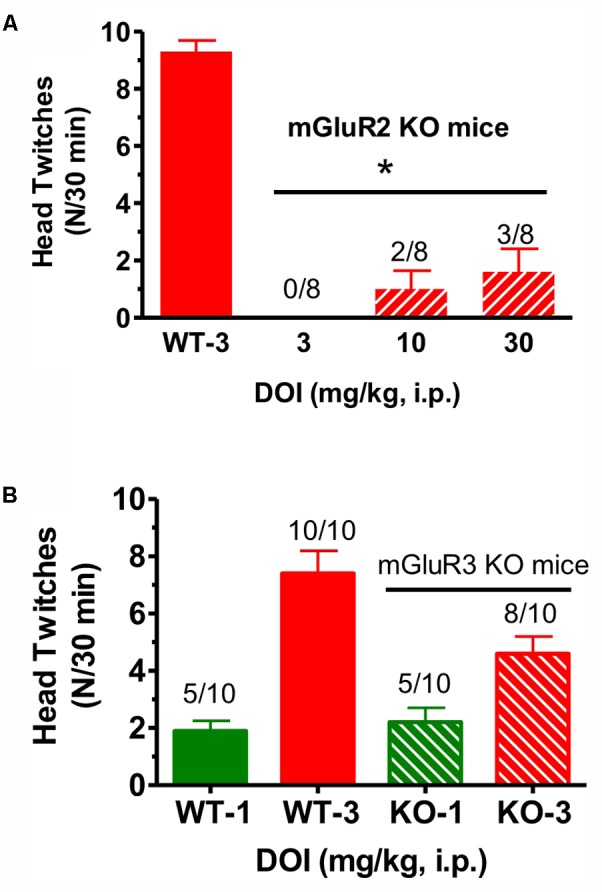
(A) The effect of DOI (3 mg/kg) on head twitches in WT and DOI (3–30 mg/kg) in mGlu2 receptor KO mice for 30 min following drug administration. Each bar represents the mean (±SEM) of eight animals after i.p. dosing. Significantly different from WT performance, ∗p < 0.05. WT, wild type; KO, knockout. (B) The effect of DOI (1–3 mg/kg) on head twitches in WT and the effect of DOI (1–3 mg/kg) on head twitches in mGlu3 receptor KO mice for 30 min following drug administration. Each bar represents the mean (±SEM) of 10 animals after i.p. dosing. WT, wild type; KO, knockout. The horizontal line is shown above the data for the mGlu2 receptor KO mice and for the mGlu3 receptor KO mice in the top (A) and lower figures(B), respectively.