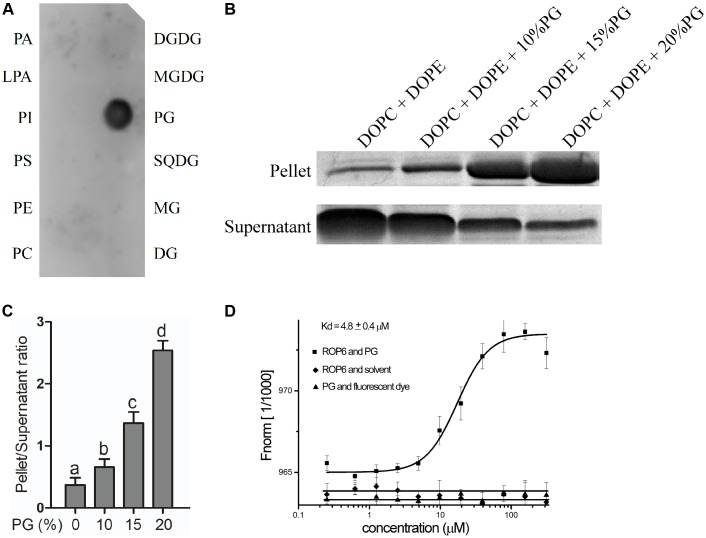
FIGURE 1.
PG binds to AtROP6. (A) Lipid-protein overlay screen assay between the recombinant protein His-AtROP6 and the lipids. His-AtROP6 was extracted and purified from E. coli. The amount of each lipid spot is 5 nmol. PA, Phosphatidic acid; LPA, Lysophosphatidic acid; PI, Phosphatidylinositol; PS, Phosphatidylserine; PE, phosphatidylethanolamine; PC, phosphatidylcholine; DGDG, digalactosyldiacylglycerol; MGDG, monogalactosyldiacylglycerol; PG, phosphatidylglycerol; SQDG, sulfoquinovosyl diacylglycerol; MG, monoglyceride, DG, diglyceride. (B) Liposome sedimentation assay between the recombinant protein His-AtROP6 and liposomes with or without PG. Liposome mixtures with a total lipid amount of 200 μg were prepared by a weight ratio of 1:1 DOPC/DOPE and a serial weight ratio of PG. The amount of PG that each liposome contained is shown on the top. Liposomes were incubated with protein His-AtROP6 and centrifuged to get liposome-bound pellet protein fraction and supernatant protein fraction. Further detection use SDS-PAGE and Coomassie Blue Staining. (C) Ratio quantitation analysis of His-AtROP6 content in (B). The protein content in the supernatant and the pellet was performed quantitation separately using ImageJ software, and then the ratio was calculated. (D) Microscale thermophoresis assay between the recombinant protein His-AtROP6 and PG. His-AtROP6 was labeled with NHS NT-647 dye and kept at a constant concentration (100 nM). PG was hydrated in 1 mL PBST buffer (0.005% tween 20, pH = 7.5) to get the stock solution 1 mg/mL. PG was titrated from 30 nM to 300 μM and the assay was carried out with 20% LED power and 20% MST power. The binding between His-AtROP6 and PG was fitted and the affinity was calculated as 4.8 ± 0.4 μM. The negative controls are the bindings between His-AtROP6 and PBST buffer solvent, and between NHS NT-647 dye and PG, which all have no binding and could not be fitted. The bar represents the mean and the error bar represents the standard error. The data was calculated from at least three independent experiments. The statistical significance was analyzed by a Student’s t-test and the significant differences (P ≤ 0.05) are indicated by lowercase letters.

