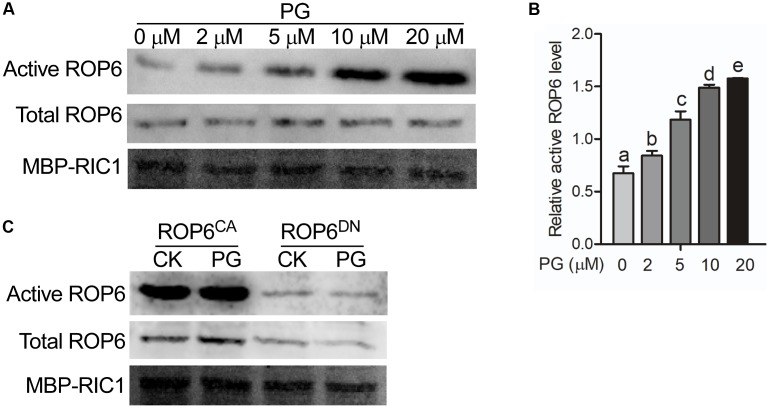
FIGURE 2.
PG activates AtROP6 in a dose-dependent manner. (A) Immunoblot analysis of active ROP6 and total ROP6 from 35S::GFP-ROP6 seedlings treated with indicated amounts of PG. The upper lane shows the immunoblot analysis of active ROP6, which was from MBP-RIC1 bound fraction. The middle lane shows the immunoblot analysis of total ROP6, which was prepared from total protein extraction. ROP6 was detected by immunoblot using anti-GFP antibody. The lower lane shows the Coomassie Brilliant Blue staining of MBP-RIC1 on PVDF membrane after immunoblot analysis. (B) Relative active ROP6 level in (A). The amount of active ROP6 and total ROP6 was performed quantitation separately using ImageJ software, and then the amount of active ROP6 was divided by the amount of total ROP6 to get the relative active ROP6 level. (C) Immunoblot analysis of active ROP6 and total ROP6 from 35S::GFP-ROP6CA and 35S::GFP-ROP6DN seedlings treated with 20 μM PG. The upper lane shows the immunoblot analysis of active ROP6. The middle lane shows the immunoblot analysis of total ROP6. ROP6 was detected by immunoblot using anti-GFP antibody. The lower lane shows the Coomassie Brilliant Blue staining of MBP-RIC1 on PVDF membrane after immunoblot analysis. The bar represents the mean and the error bar represents the standard error. The data was calculated from at least three independent experiments. The statistical significance was analyzed by a Student’s t-test and the significant differences (P ≤ 0.05) are indicated by lowercase letters.

