FIGURE 5.
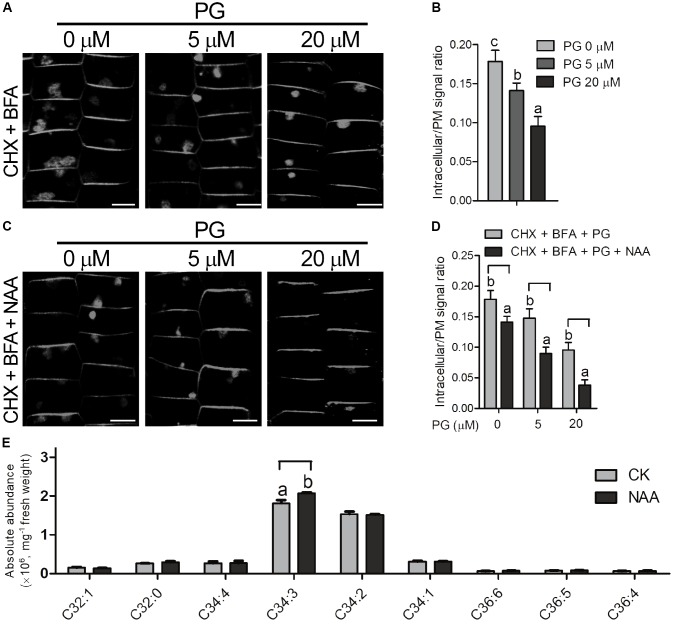
PG regulates endocytosis process coordinately with auxin. (A) The seedlings (PIN2-GFP in Col-0 background) were treated with indicated amounts of PG for 2 days, followed by treatment with CHX and indicated amounts of PG for 60 min, and then by treatment with CHX, BFA and indicated amounts of PG for 2 h. The concentration of the chemicals used: CHX, 50 μM; BFA, 50 μM. The amount of PG that each treatment used was shown on the top. Scale bar represents 5 μm. (B) Ratio quantitation analysis of PIN2-GFP signal in (A). The PIN2-GFP signal in the cytoplasm and the plasma membrane was measured separately using ImageJ software, and then the ratio was calculated (n > 20). (C) BFA-induced PIN2 internalization was more inhibited by PG and NAA. The seedlings (PIN2-GFP in Col-0 background) were treated with indicated amounts of PG for 2 days, followed by treatment with CHX and indicated amounts of PG for 30 min, and by treatment with CHX, NAA and indicated amounts of PG for another 30 min, and then by treatment with CHX, NAA, BFA and indicated amounts of PG for 2 h. The concentration of the chemicals used: CHX, 50 μM; BFA, 50 μM, NAA 5 μM. The amount of PG that each treatment used was shown on the top. Scale bar represents 5 μm. (D) Ratio quantitation analysis of PIN2-GFP signal in (A). PG content analysis in the lipid extracts of Arabidopsis roots with or without NAA treatment (E). The PIN2-GFP signal in the cytoplasm and the plasma membrane was performed measurement separately using ImageJ software, and then the ratio was calculated (n > 20). The bar represents the mean and the error bar represents the standard error. The data were calculated from at least three independent experiments. The statistical significance was analyzed by a Student’s t-test and the significant differences (P ≤ 0.05) are indicated by lowercase letters.

