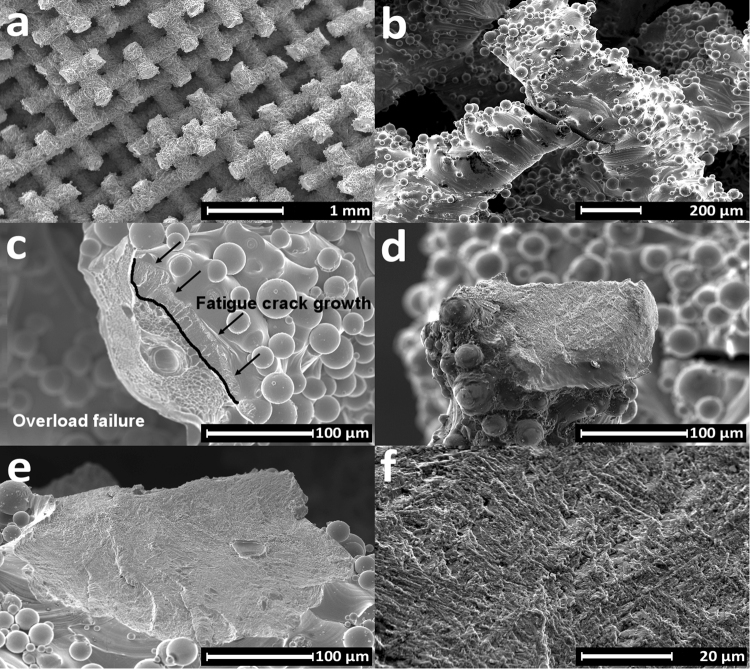
Figure 9.
Scanning electron microscopy images of fracture surface after fatigue tests: (a) Samples mostly fracture close to the nodes. (b) A crack, which initiated and propagated close to a node for tension-compression fatigue. (c) The fracture surface in tension-tension fatigue showed signs of both fatigue crack propagation (upper right) and ductile overload fracture (lower left). (d,e) The fracture surface after compression-compression fatigue failure (d) and tension-compression fatigue failure (e) showed only signs of fatigue crack propagation, no overload failure. (f) Higher magnification of crack propagation area.

