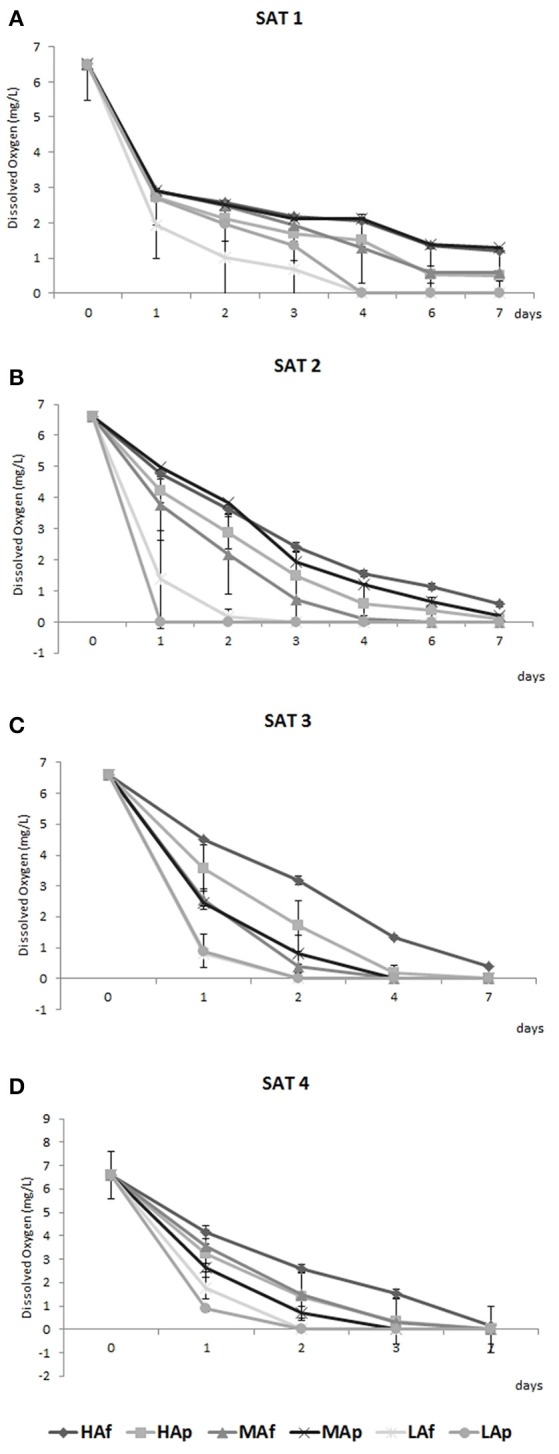
Figure 1.

Average oxygen concentrations (mg/L) measured in each wine sample after the first (A) (SAT1), the second (B) (SAT2), the third (C) (SAT3), and the fourth (D) (SAT4) saturation.

Average oxygen concentrations (mg/L) measured in each wine sample after the first (A) (SAT1), the second (B) (SAT2), the third (C) (SAT3), and the fourth (D) (SAT4) saturation.