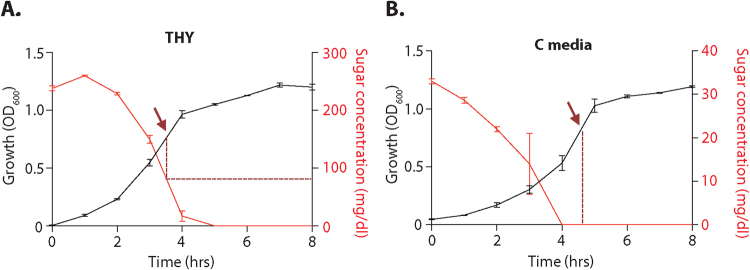
Figure 1.
Comparison of glucose concentration over growth of GAS in THY and C media. M1T1 GAS 5448 was grown in either THY (A) or C media (B), with growth (black, OD600) and total sugar (glucose) concentration (red, mg/dl measured every hour as described in Methods). Data represent the average of three replicates, shown with the standard error of the mean. The right Y axis (red) represent different levels of glucose concentrations in (A) and (B). Arrows indicate sampling point for RNA isolation and dashed lines show the glucose level at that time point.

