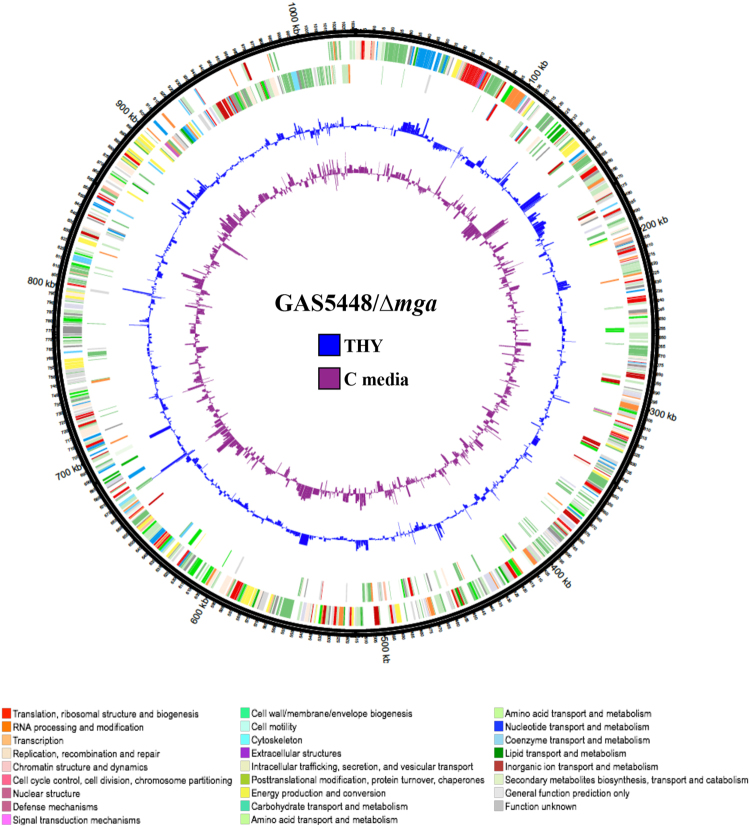
Figure 3.
Transcriptomic landscape of M1T1 5448 ∆mga mutant during growth in low and high glucose. Circos plot of genes differentially expressed (DE) between GAS 5448 compared to an isogenic ∆mga 5448.930 grown in either C media (low glucose) or THY (high glucose) at late logarithmic growth. The outer most ring represents a size ruler and the next two rings represent the GAS open reading frames (ORFs) on the (+) and (−) strand of the genome, respectively. Color of ORFs reflect their functional Cluster of Orthologous Group (COG) as indicated at bottom. The inner rings show transcript levels (inside is down regulation, outside is up regulation) with the height of the bars representing the log2 fold-change in DE in THY (blue) vs. C media (purple).

