
Figure 5.
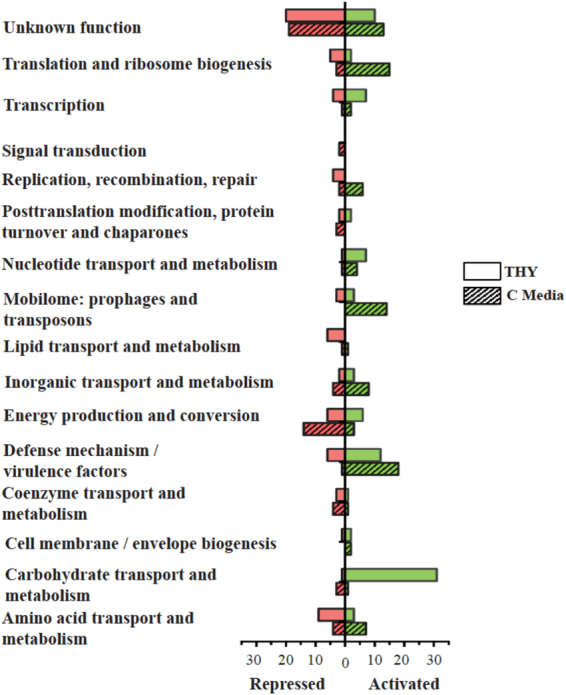
COG categories for Mga-regulated genes observed in THY and C media. A comparison of differentially expressed (DE) genes in various cluster of orthologous genes (COG) categories from THY (open bars) versus C media (crossed bars) of the GAS 5448 ∆mga 5448.930 mutant at late logarithmic growth when compared to the WT 5448. Bar length depicts the number of DE genes either down regulated (red) or up regulated (green) at p value of ≤0.05 with the total number of down and up regulated genes shown.