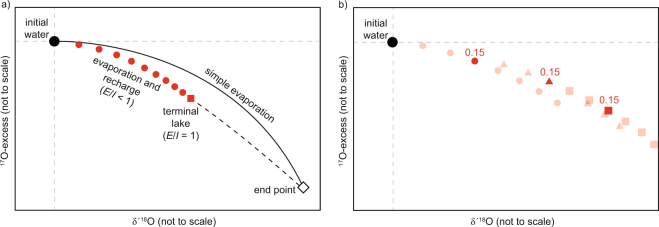
Figure 2.
(a) Conceptual comparison of water isotopic composition for simple (pan) evaporation and recharge-balanced evaporation. In the simple evaporation case, evaporating water evolves along a trajectory (solid line) towards the isotopic end-point (white diamond). At the end-point, diffusion fractionation is balanced by equilibrium fractionation7. The value of the isotopic end-point depends on *Rv and h (equation (5)). Groundwater recharge (mixing) drives the water’s isotopic composition along a trajectory below the simple evaporation trend (red dots). Increasing E/I leads to higher δ′18O and lower 17O-excess up to a value of E/I = 1 where all inflow is balanced by evaporation (i.e. a stable, terminal lake, red square). The dashed line indicates situations where evaporation exceeds inflow and the water body shrinks. (b) Visualized pond-to-pond recharge model used in this study, shown for a hypothetical series of three ponds. Red symbols indicate different hydrologic steady states at variable E/I values for pond 1 (dots), pond 2 (triangles), and pond 3 (squares). The best fit for all but the last of the Salar de Llamara ponds was obtained for E/I = 0.15. Other E/I values are shown as shaded points and depict the respective evaporation trajectories. Modeling starts from initial groundwater. Pond 1 water assumes the respective isotopic composition at E/I = 0.15. Pond 2 will assume a composition for E/I = 0.15 on a new trajectory beginning at pond 1, and so on for subsequent ponds.

