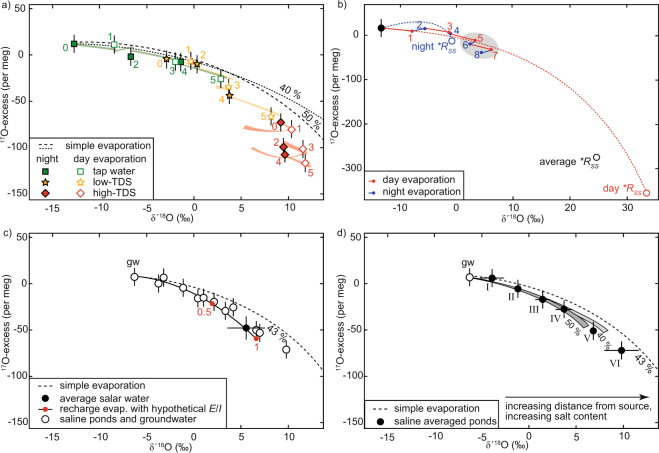
Figure 3.
(a) Oxygen isotope data from the pan evaporation experiment. The dashed lines are model curves for simple (pan) evaporation into a natural atmosphere at average relative humidity 0.4 and 0.5, respectively. The colored trajectories are model curves from sample to sample, taking into account the diurnal h-cycle (day: h = 0.35, night: h = 0.80) and the salinity effect. Numbers indicate the sample’s position in the respective sampling sequence of the three evaporation experiments. Odd numbers represent evaporation at day, even number at night. Vapor composition (δ18OV = −15.9‰) and wind turbulence (n = 0.5) are kept constant. (b) Model of a pan evaporation trajectory as in a) but extrapolated over four days for the given evaporation rate, the diurnal h-cycle, and its effect on shifting isotopic day and night end-points (*RSS). Circles represent respective isotopic end-points. Numbers indicate the evaporation sequence. (c) Isotopic composition of individual ponds and of average total salar water (asw), modelled trajectories at local average h = 0.43 for simple evaporation and for evaporation with recharge including hypothetical E/I of 0.5 and 1 (red dots). Error bars represent 1 sd of the average for δ′18O, and the external analytical reproducibility for 17O-excess. (d) Modelled evaporative succession of groundwater (gw) and ponds (averaged where composition was similar, roman numerals, see also Table 1). Grey envelopes illustrate modelled series of steady states for E/I = 0.15 at given boundary conditions and two different h (0.4 and 0.5) with an uncertainty of ±0.5‰ in the estimate of ambient atmospheric δ18OV.

