
Figure 1.
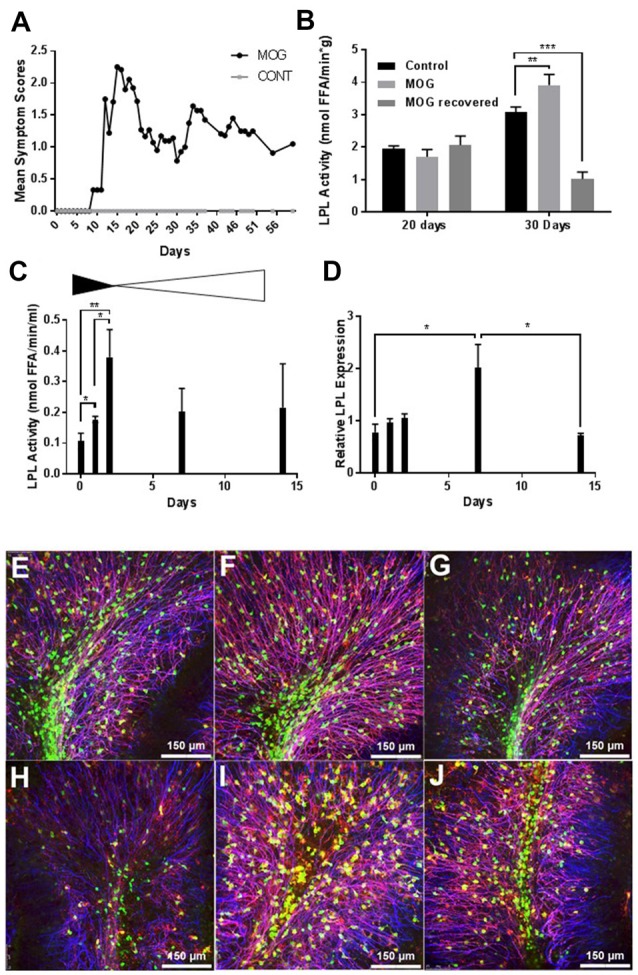
Lipoprotein lipase (LPL) is increased during de- and re-myelination. (A) Mean symptom scores of MOG treated (N = 10) and Control (N = 20) mice. (B) LPL activity in brain tissue at 20 and 30 days MOG post injection from Control (N = 20), MOG-treated (symptomatic; N = 10), and MOG-recovered (MOG-treated but asymptomatic following an initial bout of symptoms, N = 3). (C) LPL enzymatic activity in cerebellar slice cultures at 0, 1, 2, 7 and 14 days post LPC treatment (N = 3 per group, per time point). (D) LPL gene expression in cerebellar slice cultures at 0, 1, 2, 7 and 14 days post LPC treatment (N = 3 per group, per time point). (E–J) Lysolecithin-mediated demyelination of ex vivo cerebella brain slices (N = 3 per group, per time point). Blue—neurofilament (NFH), Green—PLPeGFP, Red—myelin associated glycoprotein (MAG). (E–G) No Lysolecithin control, 1, 4 and 7 days. (H–J) 1, 4 and 7 days post Lysolecithin treatment. *P < 0.05 vs. CONT (at corresponding time point). **P < 0.01 vs. CONT (at corresponding time point). ***P < 0.001 vs. CONT (at corresponding time point).