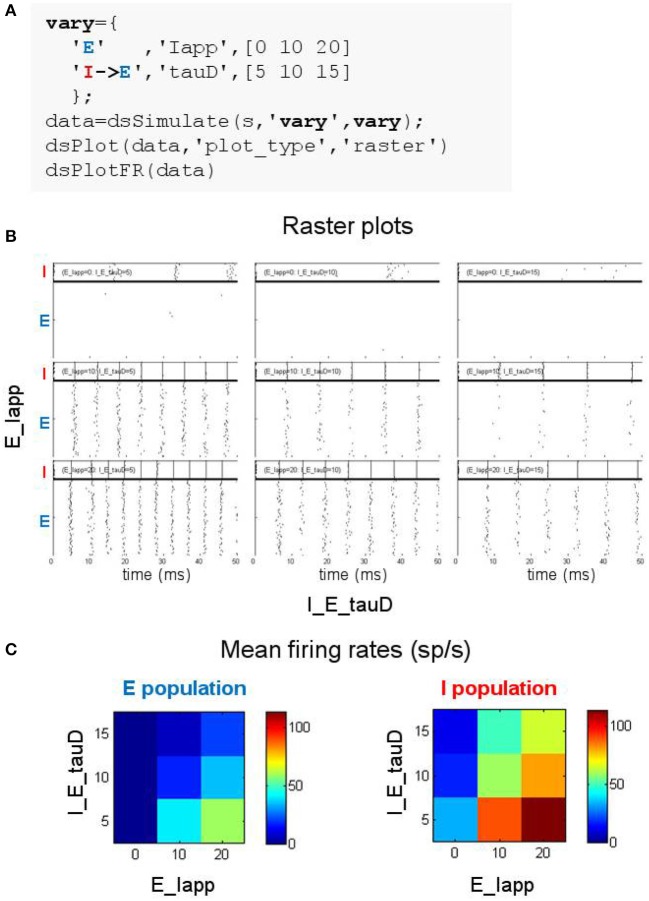
Figure 5.
Searching parameter space using the DynaSim toolbox. (A) MATLAB code using the DynaSim dsSimulate function with the vary option to specify a set of 9 simulations varying two parameters (Iapp in population E and tauD of the connection from I to E). (B) Raster plots produced by dsPlot with the plot_type option given an array of DynaSim data structures containing results for all 9 simulations. (C) Plots produced by dsPlotFR showing how mean firing rates for E and I populations change as a function of the two varied parameters.

