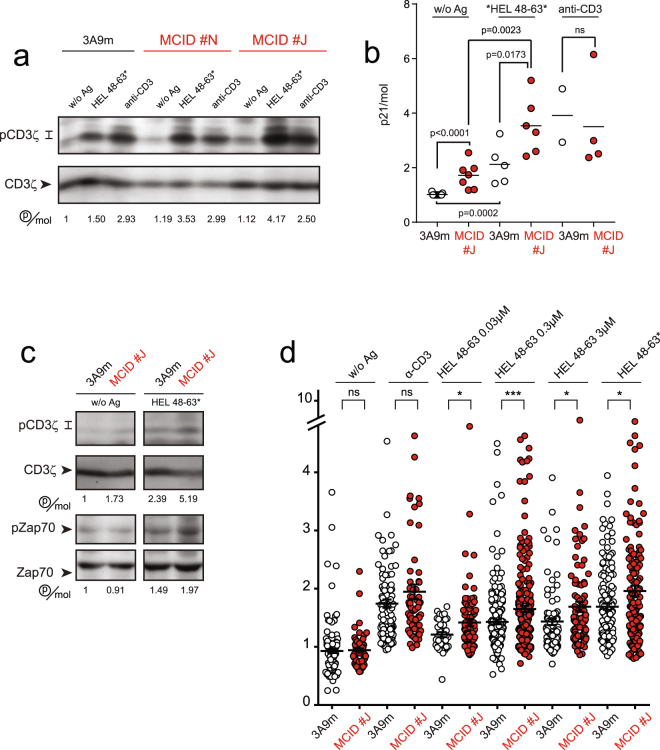
Figure 2.
The MCID expression results in the increased TCR activation and signaling. (a) 3A9m mock-transfected WT cells or MCID #N or #J clones were seeded onto COS-Ak or COS-Ak48–63* cells, or incubated with soluble anti-CD3ε mAb (145–2C11, 10 µg/ml), for 5 min at 37 °C. Cell lysates were immunoblotted with an anti-p-Tyr antibody (4G10) to detect the phosphorylated isoforms of CD3ζ (p21 and p23) or with an anti-CD3ζ antibody to detect the (p16) CD3ζ molecule, and the p21/CD3ζ ratios were quantified with a Bioimage analyzer LAS-1000. Cropped blots were shown for clarity and the uncropped blot images are displayed in Supplementary Figure S3A. (b) Statistical analysis of the p21/CD3ζ ratio from the immunoblot studies were performed as in (a). (c) Same as in (a), except that an additional analysis on the phosphorylation of Zap-70 (pTyr 319) also was included. Cropped blots were shown for clarity and the uncropped immunoblot images are displayed in Supplementary Figure S3B. (d) The Ca2+ store release analysis. T cells were loaded with PBX dye before being seeded onto APCs in presence of the CRAC blocker 2-APB (10 µM) and the fluorescence amplitude of individual cells over the threshold. T cells were stimulated with either the surface-immobilized anti-CD3ε mAb, or COS-Ak cells pulsed with various concentrations of HEL48–63 peptide or COS-Ak48–63*.

