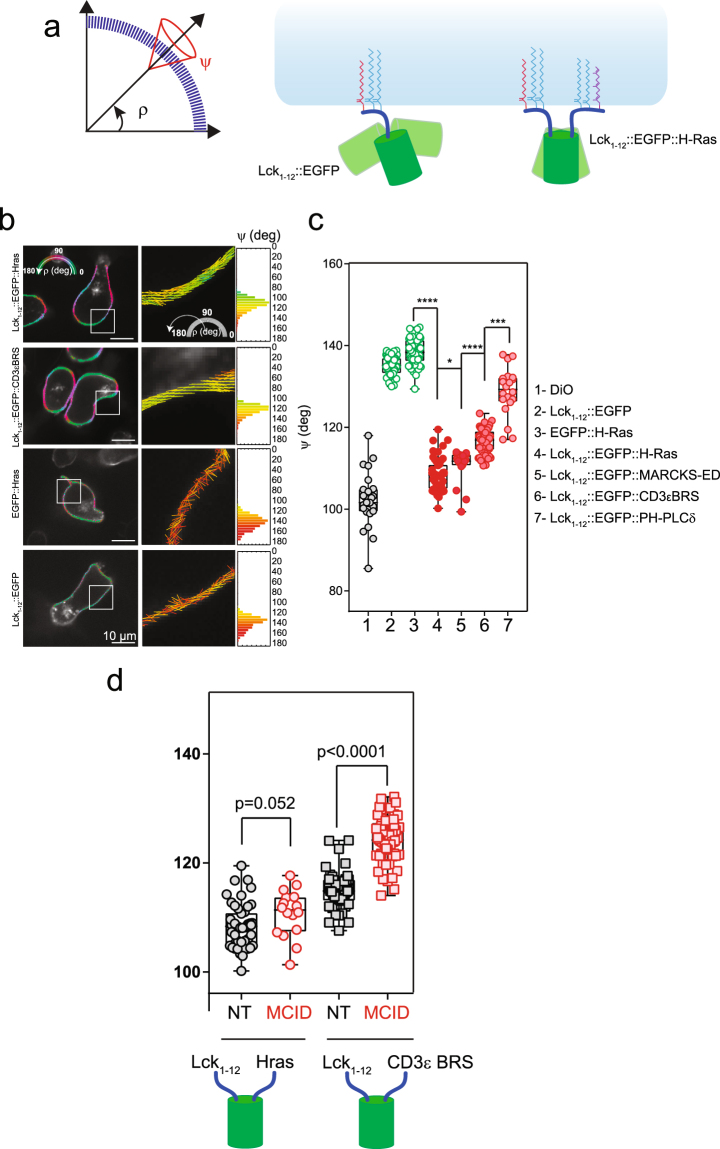
Figure 5.
The MCID expression impairs CD3ε BRS association with PM. (a) Left panel: schematics of the averaged orientation (ρ) and order (ψ) parameters measured with EPRFM. Right panel: illustration of the impact of the membrane anchores (Lck1–12 and HrasCterm, respectively) on ρ and ψ for the chimeras. (b) Left panels: polarimetric images of Lck1–12::EGFP::Hras, Lck1–12::EGFP::CD3εBRS, Lck1–12::EGFP and EGFP::Hras expressed in 3A9m cells as determined with EPRFM. Color coded pixels referring to the average ρ angle are superimposed on the grayscale fluorescence image. Middle panels: cropped pictures from the corresponding white squares in the left panel where the averaged ρ angles are indicated by the orientation of the sticks, while the averaged ψ angles define the orders by the color code, and both parameters were determined at the sub pixel level. Right panels: the frequency histogram of the ψ value for each pixel of the whole image (n > 10000 pixels). Scale bar: 10 µm. (c) Statistical analysis (box and whiskers with min to max values) of the ψ value for each fluorescent chimera in each individual cell (n > 30). ****p < 0.0001, ***p < 0.001, **p < 0.01, *p < 0.05 (Mann-Whitney test). (d) Statistical analysis (box and whiskers with min to max values) of the ψ value for Lck1–12::EGFP::Hras and Lck1–12::EGFP::CD3εBRS in each individual 3A9m cell (n > 30), with or without MCID co-expression. Exact P-values are calculated by GraphPad Prism (Mann-Whitney test).

