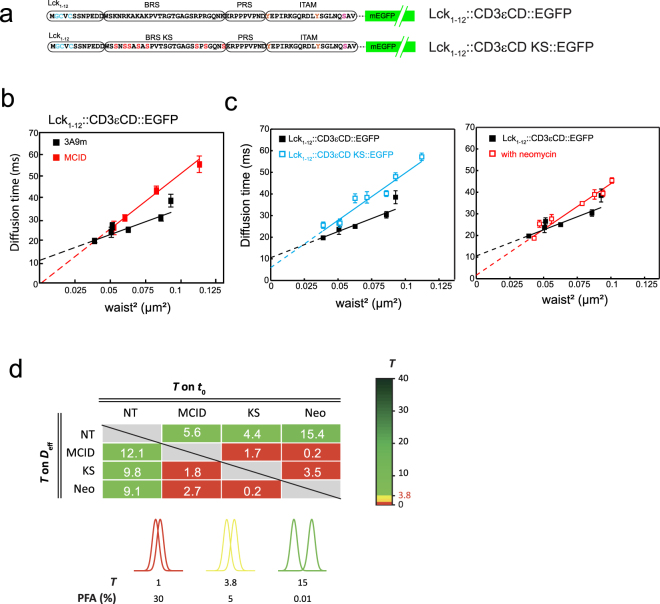
Figure 6.
svFCS analysis of membrane-anchored CD3εCD chimeras at the PM. (a) Schematics of Lck1–12::CD3εCD::EGFP and Lck1–12::CD3εCD::KS::EGFP. In the latter constructs, all the lysine residues in the BRS of CD3εCD were mutated into serine residues. (b) Comparision of the FCS diffusion laws established for Lck1–12::CD3εCD::EGFP expressed in the 3A9m T cells, in the presence (red squares) or absence of MCID co-expression (black squares). The measurements were performed at 37 °C (see Methods). (c) Left panel: comparison of the FCS diffusion law established for Lck1–12::CD3εCD::EGFP (black squares) and for Lck1–12::CD3εCD KS::EGFP (blue squares), expressed in 3A9m T cells. Right panel: comparison of the FCS diffusion law established for Lck1–12::CD3εCD::EGFP expressed in 3A9m T cells, in the presence (red squares) or absence of 2 mM neomycin pre-treatment (black squares). (d) Statistical comparison of t0 and Deff determined in the svFCS experiments. values of statistical significance were calculated by pairwise comparison of t0 and Deff and color-coded as a function of the PFA threshold (see Methods for details).

