Fig. 2.
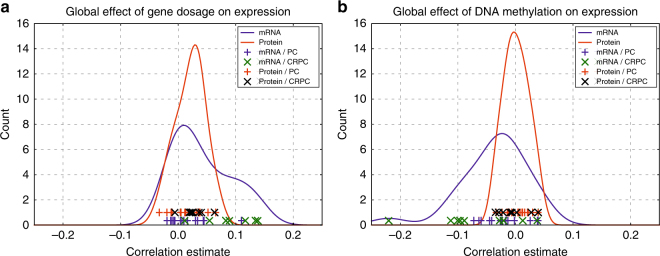
Global expression changes associated with gene copy number and DNA methylation are visible at the transcriptomic but not at proteomic level. a Correlation distributions of mRNA and protein expression with gene copy number. Lines represent effects in all analyzed genes in all samples, and show that gene dosage has higher positive correlation with mRNA expression than protein expression in prostate cancer on a global scale. Symbols on the bottom of the graph represent individual samples, and show how most of the CRPC samples have a higher positive correlation compared to PC samples at the mRNA level, as at the protein level no such difference between the disease groups is observed. b Correlation distributions of mRNA and protein expression with DNA methylation. Lines represent effects in all analyzed genes in all samples, and show that DNA methylation has higher negative correlation with mRNA expression than protein expression in prostate cancer on a global scale. Symbols on the bottom of the graph represent individual samples, and show how most of the CRPC samples have a decreased correlation compared to PC samples at the mRNA level, as at the protein level no such difference between the disease groups is observed

