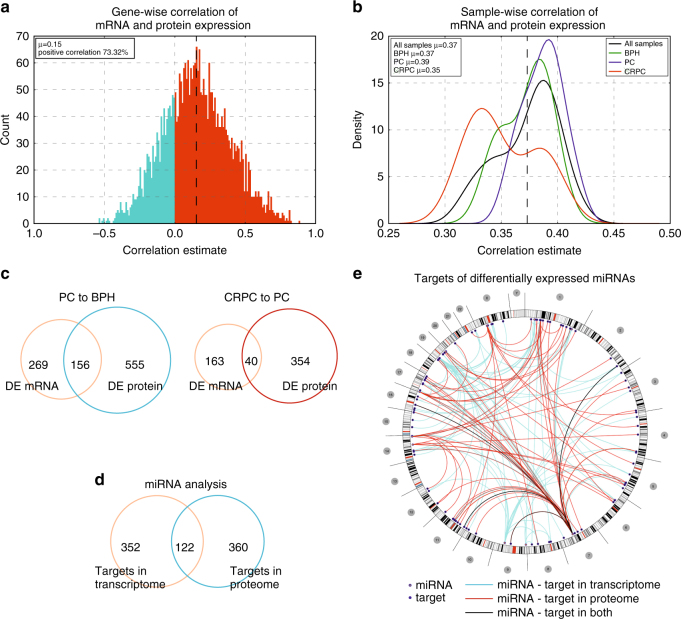
Fig. 3.
Transcriptomic and proteomic data show distinct patterns of expression at the RNA and protein level in prostate cancer. a Correlation between mRNA and protein expression of individual genes. The graph shows correlations of all genes identified in proteomic analysis in all samples used in this study. Most of the genes (>73%) show positive correlation between expression of their mRNA and protein. μ is the mean of the correlations. b Disease group-wise correlation between mRNA and protein expression of the genes identified in the proteomic analysis shows that in CRPC there is a decreased correlation between mRNA–protein expression pairs compared to primary PC. Compared to all samples (black line) and BPH (green line), the PC samples (blue line) have a higher correlation between their mRNA-protein expression pairs, while CRPC samples (red line) have a lower correlation. µ is the mean of the correlations. c Venn diagram showing the numbers differentially expressed (DE) genes in PC vs BPH and CRPC vs PC comparisons identified based on mRNA or protein expression. The numbers of overlapping genes show that only a minority of the differentially expressed genes show expression changes in both mRNA and protein levels. d Venn diagram showing the numbers of genes that are negatively correlating with a targeting miRNA based on their expression at the mRNA or protein level. Only a minority of the miRNA targets are identified both at the mRNA and protein level, indicating that correlations at the protein level help to identify mostly a different pool of miRNA targets than correlations at the mRNA level. e Circos plot depicting genomic locations of miRNAs and their targets that are both negatively correlating at expression, as well as differentially expressed during prostate cancer progression (CRPC vs PC samples). Outer ring indicates chromosomes and cytobands, with chromosome numbers in the gray circles. Each line in the center maps a prostate cancer-related miRNA-target pair indicated through transcriptomic (blue lines), proteomic (red lines), or both (black lines) analyses. The blue circles mark the genomic location of the miRNAs, and the solid blue dots mark the targets

