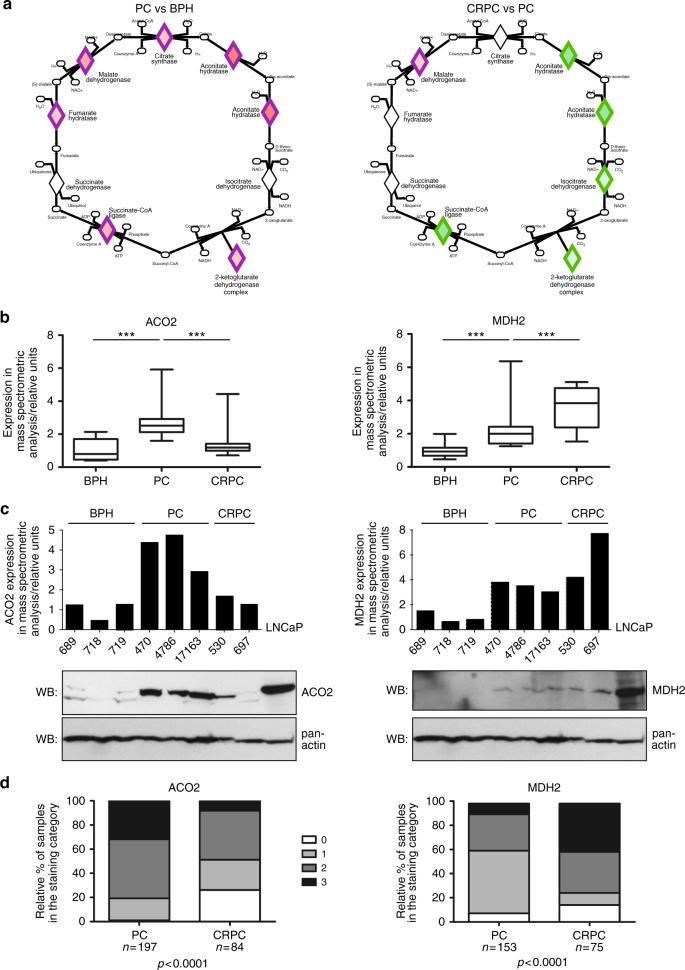
Fig. 5.
TCA cycle is differentially regulated during prostate cancer progression. a A schematic view of the TCA cycle protein expression changes in PC vs BPH and CRPC vs PC comparisons according to the Ingenuity Pathway Analysis. Differential expression of TCA enzymes (diamonds) are highlighted in green (downregulation) and red (upregulation). As mostly the same enzymes are involved in both PC and CRPC, the primary mode of expression change is upregulation in PC and downregulation in CRPC. b Examples of a typical (ACO2) and a unique (MDH2) TCA protein expression patterns as identified by mass spectrometry proteomics. ACO2 is upregulated in PC compared to BPH, and gets downregulated in CRPC compared to PC. MDH2 protein expression levels increase in PC compared to BPH, and continue to increase in CRPC. Boxplots show interquartiles with mean values, whiskers represent minimum and maximum values. ***p-value < 0.001 (Mann–Whitney test). c ACO2 and MDH2 protein expression patterns verified in a subset of BPH, PC, and CRPC samples by western blotting. ACO2 and MDH2 protein expression according to the proteomic mass spectrometry analysis (upper panel bar graph) and in corresponding samples according to western blotting (WB; lower panels). Pan-actin is used as a loading control. d Change in ACO2 and MDH2 protein expression patterns during progression of prostate cancer verified by immunohistochemistry. Immunohistochemical analysis in clinical tumor samples of PC and CRPC show statistically significantly decreased ACO2 and increased MDH2 staining intensity in CRPC compared to PC and (Chi squared test; 0 = no staining, 1 = weak staining, 2 = intermediate staining, 3 = strong staining)

