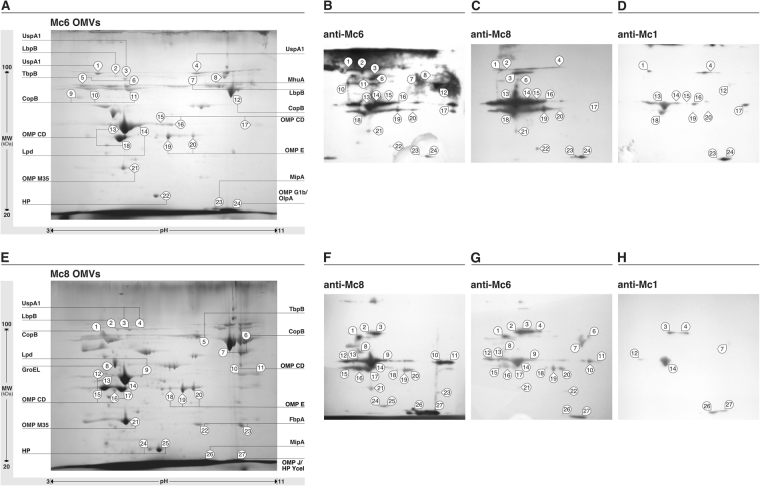
Figure 2.
Immunoproteomic analyses of M. catarrhalis OMV preparations. After 2D-gel electrophoresis OMV proteins were visualized by Coomassie staining (A,E). 2D immunoblots probed with homologous antisera (B,F), stronger cross-reactive antisera (C,G) and weaker cross-reactive antisera (D,H). Molecular size markers are indicated on the left. The exposure times for chemiluminescent substrate were exactly the same for each presented blot. Gel and blot images are cropped and brightness/contrast-adjusted for better readability. Original images are shown in Supplementary Fig. S2.

