Figure 5.
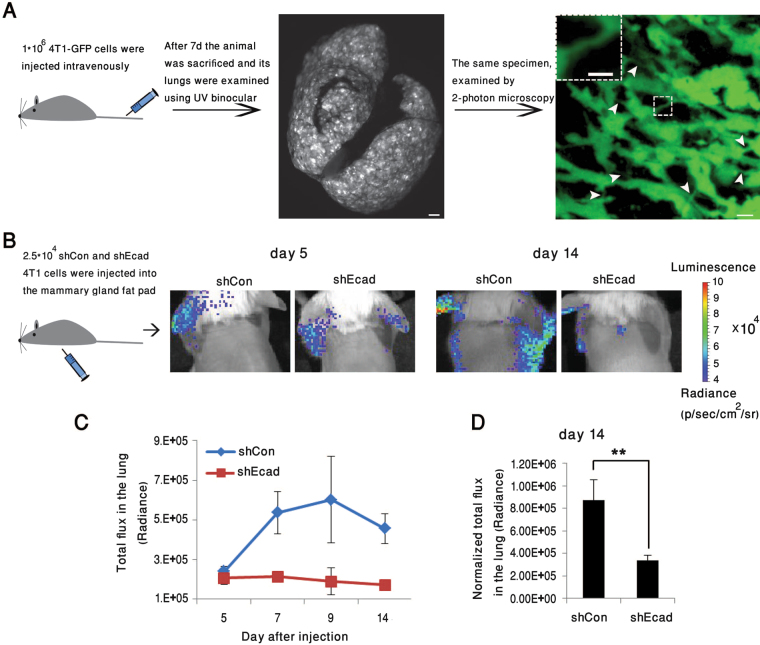
Effect of E-cadherin knockdown on the formation of lung metastases following injection of 4T1 cells into BALB/c mice. (A) 4T1-GFP cells (1*106 cells) were injected intravenously into the tail veins of BALB/c mice. Seven days later, animals were sacrificed, and their lungs imaged using 2-photon microscopy. Examination of the images revealed loosely packed metastatic nodules with multiple tethers running between the cells (arrowheads). Scale bar: Middle image − 10 mm; right image − 10 μm; insert − 5 μm. (B) Representative bioluminescence images (BLI), taken on days 5, 14, and 21, post-injection of 2.5*104 4T1-luciferase shCon or shEcad cells into the mammary fat pads of BALB/c mice (n = 4/5 mice in each group, respectively). (C,C’) BLI quantification of total flux in the lungs of shCon or shEcad mouse groups. Note that the accumulation of tumor cells in the lungs during the 14–21 day post-injection period was over twofold lower in the E-cadherin knocked-down cells, compared to the control 4T1 cells. (D) BLI quantification of total flux of 4T1-luciferase shCon or shEcad in the lungs of BALB/c mice, studied in two separate fat-pad injection experiments (n = 9/10 for each shCon or shEcad group, respectively). Data were collected on Day 14, and statistical significance of the differences between the groups was determined, using two-way ANOVA (**p = 0.009).

