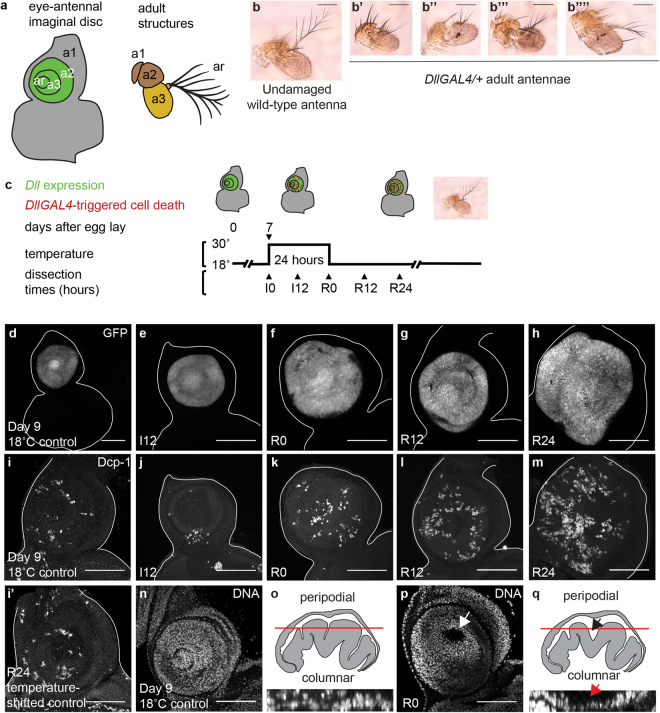
Figure 1.
High DllGAL4 expression induces cell death in the antennal disc. (a) Diagram showing regions of the eye-antennal imaginal disc and corresponding adult structures. a1, a2, a3 and ar are first, second, and third antennal segments and the arista, respectively. The green region shows Distal-less expression. (b) Undamaged wild-type adult antenna. (b’–b””) Adult antennae from DllGAL4/+ animals raised at 25 °C. The antennae showed a range of altered morphology. The aristae and the third antennal segments were the most affected. (c) The protocol used to observe DllGAL4-induced phenotypes. Animals were raised at 18 °C and shifted to 30 °C for 24 hours during early third-instar larval development (day 7 AEL). Larvae were returned to 18 °C and allowed to pupariate and eclose or were dissected at the time points noted during damage induction (I) or recovery (R). (d–h) DllGAL4 expression marked by UAS-EGFP in a day 9 18 °C control disc (DllGAL4/+), which is developmentally similar to R0 (d), and temperature-shifted DllGAL4/+ discs at I12 (e), R0 (f), R12 (g), and R24 (h). (i and i’) Dying cells marked using an antibody for the cleaved form of the effector caspase Dcp-1 in a day 9 18 °C control disc (DllGAL4/+) (i) and a temperature-shifted control disc (w1118; +/SM6.TM6B) at R24 (i’). Note that there was no temperature-induced increase in cleaved Dcp-1 positive cells in these control discs. (j–m) A progressive increase in dying cells was seen during induction and recovery times as marked by cleaved Dcp-1 immunostaining. Note that I12 discs had less apoptosis compared to control discs, due to I12 discs being developmentally younger. (n and p) Disc morphology was affected, as visualized with nuclear staining of the antennal epithelium using TO-PRO-3 in day 9 18 °C control discs (n) and R0 discs (p). In (p) the arrow marks the gap between the peripodial and columnar epithelia. (o) Orthogonal view of part of the disc shown in (n) and diagram of a cross-section of an undamaged antennal disc. The red line shows the approximate level of the confocal image of the undamaged epithelium shown in (n). (q) Orthogonal view of part of the disc shown in (p) and diagram of a cross-section of an R0 disc. The arrows indicate the gap between the epithelial layers visible in (p). Scale bars are all 100 μm.

