Figure 4.
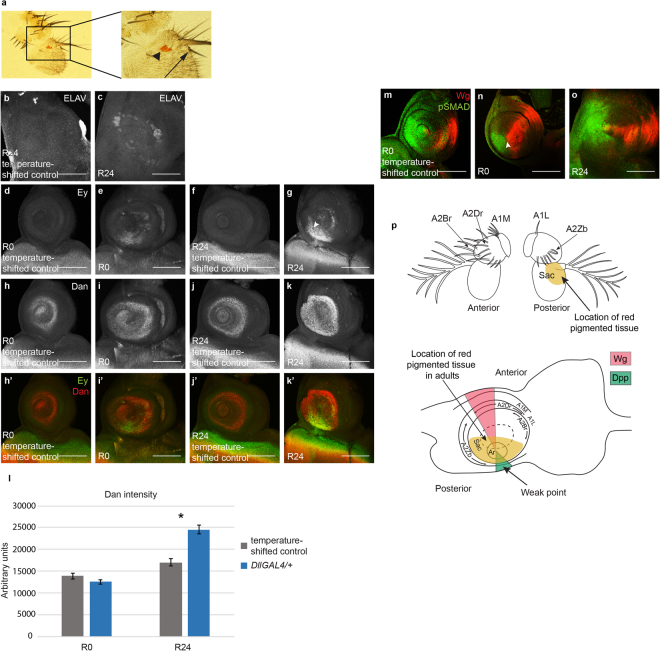
GAL4 expression induces antenna-to-eye fate changes. (a) Adult antenna from a DllGAL4/+ animal raised at 25 °C. Arrowhead marks the red pigmented tissue in the third antennal segment. Arrow shows the presence of a bracted bristle also on the third antennal segment. (b) Anti-ELAV staining was absent in the antennal segments in a temperature-shifted control disc (+; +/SM6.TM6B) at R24. (c) Ectopic ELAV staining occurred in a ring pattern in an (DllGAL4/+) R24 disc. (d–g) Anti-Eyeless (Ey) staining was absent in temperature-shifted control discs at both R0 (d) and R24 (f). Ey was ectopically expressed as early as R0 (e) and increased in area and intensity by R24 (g). Note that Ey expression was present near the weak point in the antennal disc, arrowhead in (g). (h–k) Anti-Dan expression in a temperature-shifted control disc at R0 (h), an R0 disc (i), a temperature-shifted control disc at R24 (j) and an R24 disc (k). (h’–k’) Merge of Anti-Ey (d–g) and Anti-Dan (h–k). (d–k’) Images were taken with the same confocal settings to enable comparison of fluorescence levels. (l) Graph showing Dan immunofluorescence intensity in temperature-shifted control discs at R0 (n = 16), R0 discs (n = 16), temperature-shifted control discs at R24 (n = 16) and R24 discs (n = 17). *p = 0.000001. (m–o) Anti-Wg (red) and Anti-pSMAD (green) immunostaining in a temperature-shifted control disc at R0 (m) and in discs at R0 (n) and R24 (o). Arrowhead in (n) shows the region of overlap of Wg and pSMAD. (p) Fate map of the antennal imaginal disc adapted from Haynie and Bryant52. Adult structures of the antenna are labelled showing anterior and posterior views. A1L = antennal segment 1: isolated dorsal lateral bristle, A1M = antennal segment 1: dorsal medial bristles, A2Br = antennal segment 2: large anterior bristles, A2Dr = antennal segment 2: small anterior row bristles, A2Zb = antennal segment 2: posterior tooth bristles, Sac = antennal segment 3: sacculus. Light brown region shows the fate change zone that acquired red pigmented tissue in the adults. The corresponding locations of these structures are labelled on the antennal imaginal disc. Pink and green regions mark Wg and Dpp expression, respectively. Error bars represent SEM. Student’s T-test used for statistical analysis. Scale bars are 100 μm.

