Fig. 4.
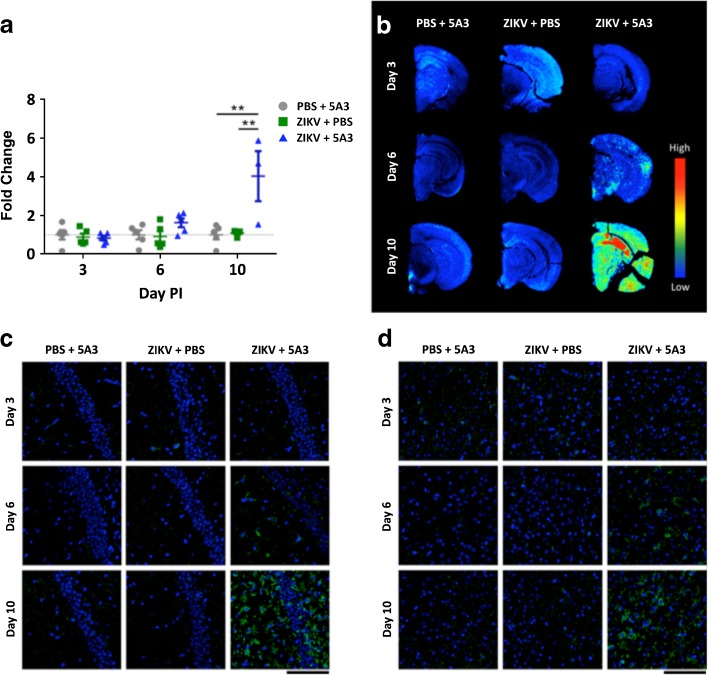
Iba-1 is increased in the brains of ZIKV-infected wild-type mice treated with an IFNAR1-blocking MAb. Brain sections analyzed for Iba-1 expression by infrared (IR) and immunofluorescent imaging for all three treatment groups, PBS + 5A3, ZIKV + PBS, and ZIKV + 5A3. a By day 10 PI, the average IR intensity was increased approximately fourfold relative to PBS + 5A3 controls (**p < 0.01, one-way analysis of variance (ANOVA)). Symbols, line, and error bars represent the individual mice, group mean, and standard deviation, respectively. b Representative images show increased Iba-1 IR signal in brain sections from ZIKV + 5A3 mice compared with PBS control groups. c Representative CA1 hippocampal and d cortical sections showing immunofluorescent labeling of Iba-1 (green) and nuclei (blue) in PET imaging mice. Scale bar represents 200 μm.

